

National Underwriter's Top 100 and Heads of the Lineslists — the data for which is provided by S&P Global MarketIntelligence — offer a look at who's on top, who's taken a hit, andwho's making progress in a crowded and highly competitive P&Cmarket.
|It also serves as a reminder that when it comes to premiumearners in the top 100 groups and companies, there is the Top 10 —and then there's Everyone Else. The top 10 groups (ranked here bynet premiums written, in $000s) represent some $182 billion (nearly40%) of the approximate $473 billion total NPW among the top100.
|With a few exceptions, the top 10 groups and companies remainunchanged from years past, but that doesn't mean there aren'tstories to tell once you delve into the data. Consider some of thebiggest gainers in terms of percent growth: Among them, NationalGeneral Holdings Corp., which posted nearly 20% growth in NPW;Alleghany Corp., which increased its NPW by 15.44%; and NavigatorsGroup Inc., which showed 11.61% improvement in NPW while alsoreducing its combined ratio by 2.46 points to 93.37.
|While AIG remains ensconced in the top 10Groups, its combined ratio in 2016 was one of the highest in theindustry, at 131.33. The carrier says that combined ratio figure"reflects prior year development, widely reported at this point,which we have addressed through our adverse development cover withBerkshire for accident year 2015 and prior, and by setting moreconservative loss picks for AY 2016 and 2017, to further protectagainst future prior year development," according to a spokesman."It is important to note that improvements in business mix and theincreased use of underwriting tools and analytics led to a 4.1improvement in our adjusted AY loss ratio in financial year 2016 to66.7 from 70.8 in financial year 2015, after adjusting the prioryear for the increase in loss picks."
|AIG's decline in NPW, meanwhile, "reflects our strategy toimprove Commercial's underwriting results," the company said."About half of the decline is related to the increased use ofreinsurance and exits from highly unprofitable lines, mostly inU.S. casualty, where portfolio remediation efforts are mostintensely focused." The remaining half, a spokesman added, "isrelated to improved risk selection and increased use of tools and analytics, whichhelped bring about the 4.1 point year-over-year improvement in ouradjusted accident year loss ratio to 66.7 in financial year 2016,as mentioned. Our focus at AIG is on key growth areas that offercompelling value."
|Allianz Group's percent decline in NPW is atleast in part attributable to the fact that not all of itssubsidiaries report their figures to the NAIC; its reportedcombined ratio, however, doesn't help, at 138.08. On the companyside, readers may note a huge increase in NPW growth (94.24%) forAllianz Global Risks U.S. Ins. Co. The spike, according to S&PGlobal Market Intelligence, is caused by an intercompany poolingarrangement which included Fireman's Fund Insurance Co. in 2016;previously, Fireman's Fund was not part of the poolingarrangement.
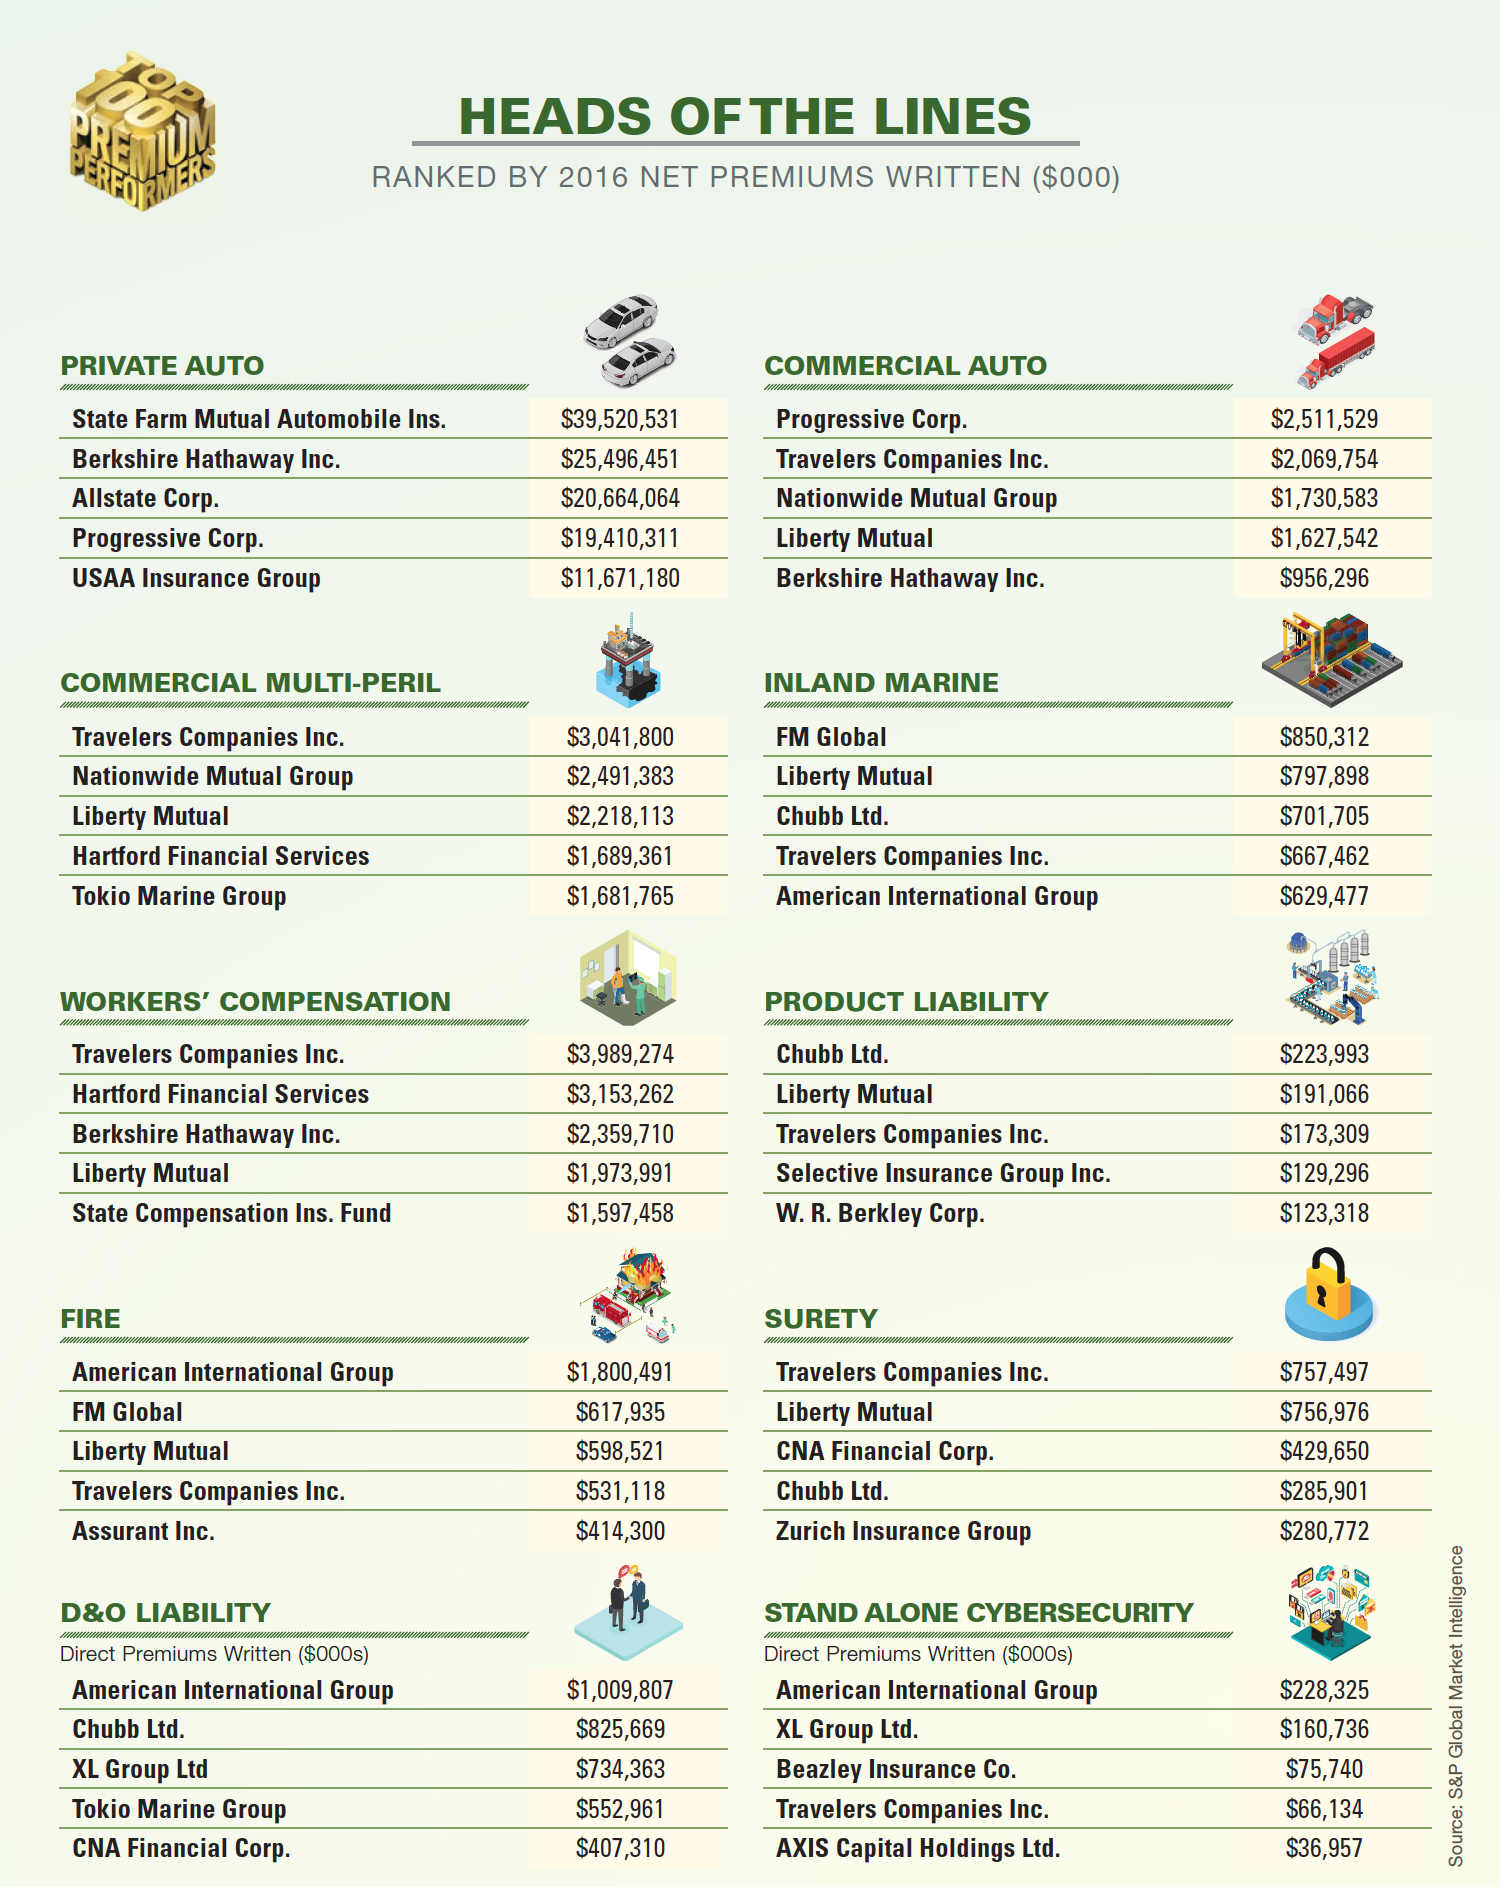
|Meanwhile, in individual product lines, what is striking is theamount of net premiums being garnered by two key players in writingstand-alone Cybersecurity: AIG and XL Group. It's also worth notingthat in last year's rankings, AIG hadn't cracked the top five; thistime, it leads the pack.
|The S&P Global Market Intelligence data throughout thisfeature is derived from all U.S. companies that file with theNational Associationof Insurance Commissioners (NAIC). The rankings in individuallines (Commercial Auto, Inland Marine, Fire, etc.) reflect netpremiums written (in $000s), with the exception of Directors andOfficers and stand-alone Cybersecurity — which are ranked bydirect premiums written due to the fact that NAICstatements do not disclose net premiums written for thoselines.
|(Click images to enlarge.)
|


Want to continue reading?
Become a Free PropertyCasualty360 Digital Reader
Your access to unlimited PropertyCasualty360 content isn’t changing.
Once you are an ALM digital member, you’ll receive:
- All PropertyCasualty360.com news coverage, best practices, and in-depth analysis.
- Educational webcasts, resources from industry leaders, and informative newsletters.
- Other award-winning websites including BenefitsPRO.com and ThinkAdvisor.com.
Already have an account? Sign In
© 2024 ALM Global, LLC, All Rights Reserved. Request academic re-use from www.copyright.com. All other uses, submit a request to [email protected]. For more information visit Asset & Logo Licensing.


