

It’s pretty obvious to most drivers that roads in the UnitedStates, especially the interstate highway system, are indisrepair.
|Potholes and uneven road surfaces are the most obvious problems.But all over the country, roads are crumbling and bridges are indanger of falling down.
|As roads get worse, the potential for accidents increases, anddrivers may have more flat tires, broken axles and crackedwindshields, leading to more auto insurance claims.
|To provide an overview of the status of the country’sinfrastructure, every four years, the American Society of CivilEngineers (ASCE) provides a comprehensive assessment of 16major categories in ASCE’s Infrastructure Report Card. Using a simple A to Fschool report card format, the Report Card examines currentinfrastructure conditions and needs, assigns grades and makesrecommendations to raise them.
|In addition to providing a national report card, ASCE preparesstate and regional report cards, on a rollingbasis, following the same methods and grading system.
|A — Exceptional, fitfor the future.
|B — Good, adequatefor now.
|C — Mediocre,requires attention.
|D — Poor, atrisk.
|F — Failing/critical,unfit for purpose.
|Overall, ASCE gives U.S. roads a grade of D. They are oftencrowded, frequently in poor condition, chronically underfunded, andare becoming more dangerous, ASCE says. More than two out of everyfive miles of the U.S. urban interstates are congested, and trafficdelays cost the country $160 billion in wasted time and fuel in2014. One out of every five miles of highway pavement is in poorcondition, and U.S. roads have a significant and increasing backlogof rehabilitation needs.
|Related: 10 ways cities can enhance risk management andbuild resilience
|How did the roads get so bad? ASCE points out that the U.S. hasmore than four million miles of roads crisscrossing the UnitedStates, from 15-lane interstates to residential streets. In 2016alone, U.S. roads carried people and goods over three trillionmiles — or more than 300 round trips between Earth and Pluto.
|Here are the 10 states with the worst roads in the country andkey facts about each one, according to ASCE:
|
(Photo: Shutterstock)
|1. Connecticut: 57 percent
- 21,512 miles of public roads,with 57 percent in poor condition.
- 338 (8 percent) ofthe 4,214 bridges are structurallydeficient.
- $864 per motorist per year in costs fromdriving on roads in need of repair.
Related: Here are the top 10 states people are movingfrom
|
(Photo: Shutterstock)
|2. Rhode Island: 54 percent
- 16,691 miles of public roads,with 54 percent in poor condition.
- 192 (24.9 percent) ofthe 772 bridges are structurallydeficient.
- $810 per motorist per year in costs fromdriving on roads in need of repair.
Related: Hail, water and wind are top auto perils betweenMarch and May
|
Photo: (Shutterstock)
|3. California: 50 percent
- 1,388 (5.5 percent) ofthe 25,431 bridges are structurallydeficient.
- 195,834 miles of public roads,with 50 percent in poor condition.
- $844 per motorist per year in costs fromdriving on roads in need of repair.
Related: What local officials and insurers can learn fromthe Oroville Dam crisis
||
(Photo: Shutterstock)
|4. Hawaii: 39 percent
- 64 (5.7 percent) ofthe 1,132 bridges are structurallydeficient.
- 4,455 miles of public roads,with 39 percent in poor condition.
- $708 per motorist per year in costs fromdriving on roads in need of repair.
Related: Volcano claims and coverage
(Photo: Shutterstock)
|5. New Jersey: 38 percent
- 609 (9 percent) ofthe 6,730 bridges are structurallydeficient.
- 39,065 miles of public roads,with 38 percent in poor condition.
- $667 per motorist per year in costs fromdriving on roads in need of repair.
Related: FEMA to pay 90 percent of costs to repair damage toHolland Tunnel caused by Sandy
|
(Photo: Shutterstock)
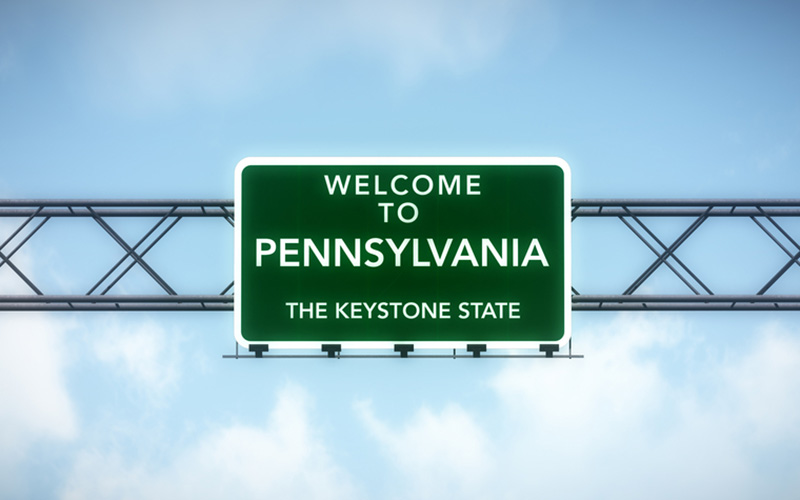
|6. Pennsylvania: 32 percent
- 4,506 (19.8 percent) ofthe 22,791 bridges are structurallydeficient.
- 120,091 miles of public roads,with 32 percent in poor condition.
- $606 per motorist per year in costs fromdriving on roads in need of repair.
Related: It’s winter! Do you know the biggest risks on theroad in your region?
|
(Photo: Shutterstock)
|7. Washington: 31 percent
- 392 (4.8 percent) ofthe 8,178 bridges are structurallydeficient.
- 14,252 miles of public roads,with 31 percent in poor condition.
- $656 per motorist per year in costs fromdriving on roads in need of repair.
Related: Here are the top 10 states people are movinginto
|
(Photo: Shutterstock)`
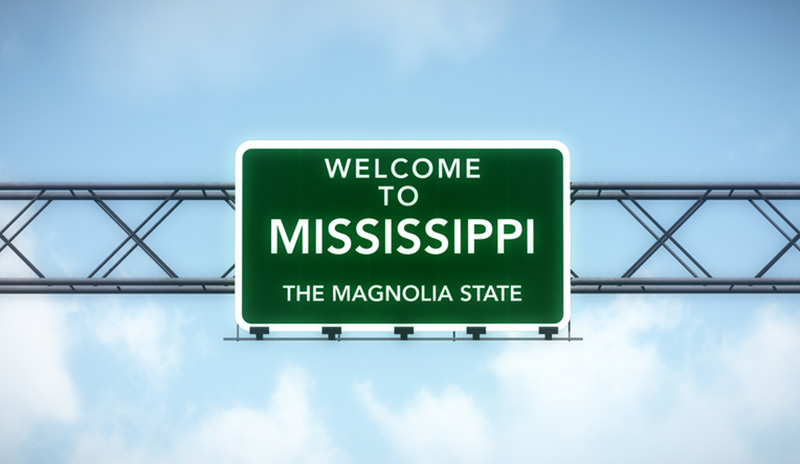
|8. Mississippi: 28 percent
- 2,098 (12.3 percent) ofthe 17,068 bridges are structurallydeficient.
- 76,777 miles of public roads,with 28 percent in poor condition.
- $705 per motorist per year in costs fromdriving on roads in need of repair.
Related: 10 poorest states in America
|
(Photo: Shutterstock)
|9. New York: 28 percent
- 1,928 (11 percent) ofthe 17,462 bridges are structurallydeficient.
- 114,365 miles of public roads,with 28 percent in poor condition.
- $571 per motorist per year in costs fromdriving on roads in need of repair.
Related: Could high-speed passenger trains be in ourfuture?
|
(Photo: Shutterstock)
|10. Wisconsin: 27 percent
- 1,232 (8.7 percent) ofthe 14,230 bridges are structurallydeficient.
- 80,338 miles of public roads,with 27 percent in poor condition.
- $637 per motorist per year in costs fromdriving on roads in need of repair.
Related: Top 10 personal auto carriers for 2016, as rankedby NAIC
||Top 18 states with the worst roads
The following chart shows the 18 states with the worst roads in theUnited States, according to the ASCE. For more information aboutkey facts related to your state’s infrastructure, check out theASCE’s 2017 Infrastructure Report Card, as well as thestate-by-state reports.
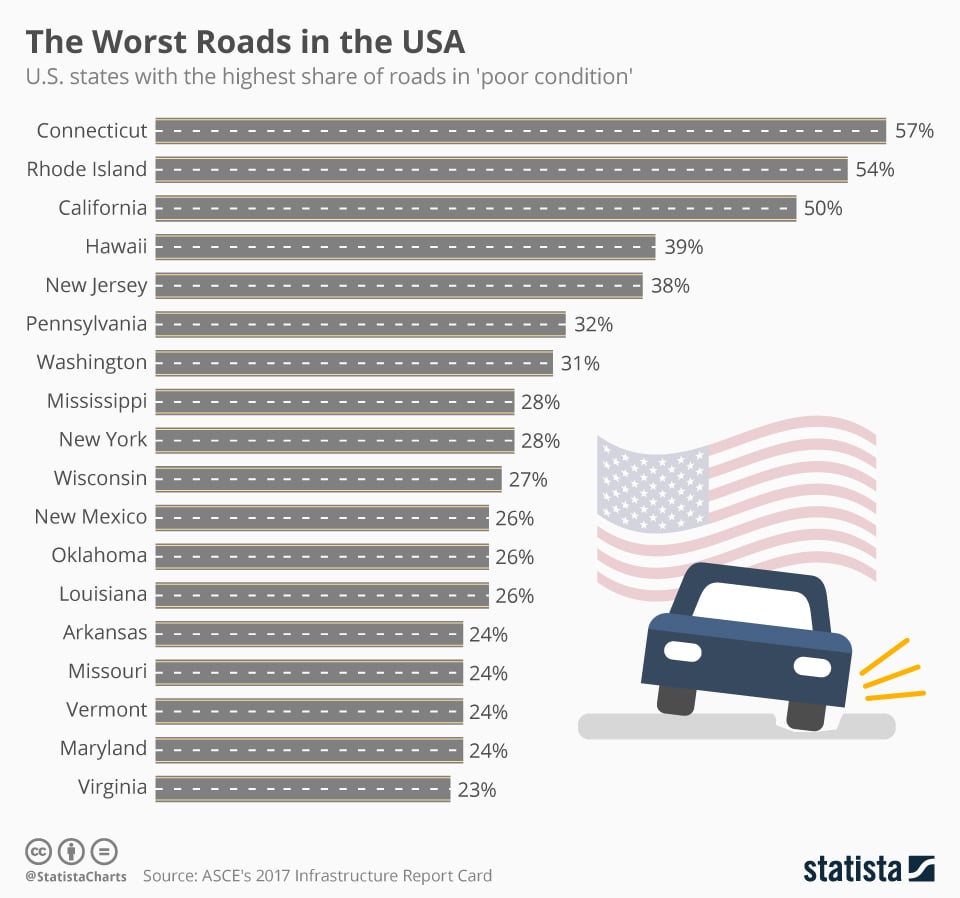
Source: Statista
|Related: Top 10 commercial auto carriers for 2016, as rankedby the NAIC
Want to continue reading?
Become a Free PropertyCasualty360 Digital Reader
Your access to unlimited PropertyCasualty360 content isn’t changing.
Once you are an ALM digital member, you’ll receive:
- All PropertyCasualty360.com news coverage, best practices, and in-depth analysis.
- Educational webcasts, resources from industry leaders, and informative newsletters.
- Other award-winning websites including BenefitsPRO.com and ThinkAdvisor.com.
Already have an account? Sign In
© 2024 ALM Global, LLC, All Rights Reserved. Request academic re-use from www.copyright.com. All other uses, submit a request to [email protected]. For more information visit Asset & Logo Licensing.
Rosalie Donlon
Rosalie Donlon is the editor in chief of ALM's insurance and tax publications, including NU Property & Casualty magazine and NU PropertyCasualty360.com. You can contact her at [email protected].


