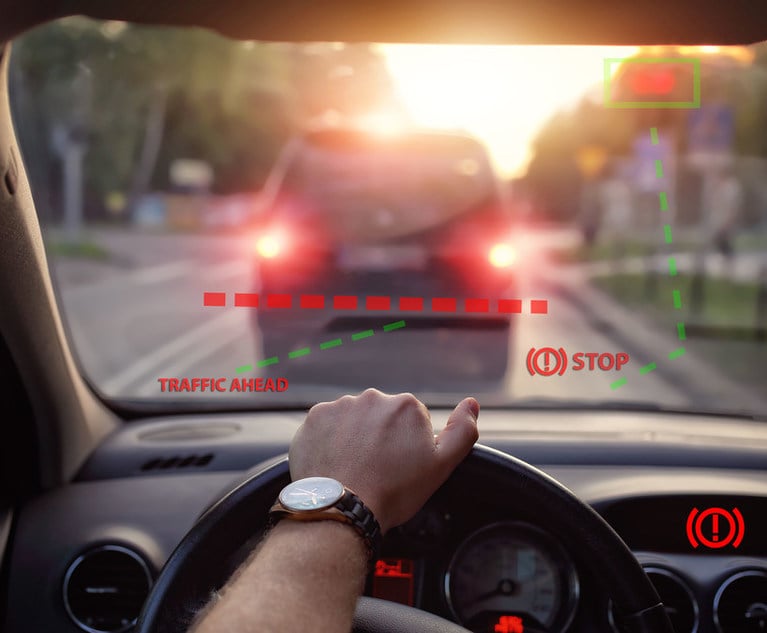
Americans continue to love their automobiles.
|Only 7.4 percent of households in the United States recentlyreported that they had no vehicle, according to the AAA Foundation for Traffic Safety inWashington, D.C.
|In order to offer valuable, personalized customerservice, it's important for auto insurance agents tounderstand drivers, their insurance needs and driving habits.
|A snapshot of U.S. drivers
Thefoundation's latest American Driving Survey revealed thatAmericans drove a total of 2.45 trillion miles last year, which isa 2.4 percent increase from 2014.
|“The amount of time the average driver spends behind the wheeleach year is equivalent to seven 40-hour weeks at the office,” saysJurek Grabowski, the foundation's research director. “It’s clearthat traveling by car remains a central part of American’slives.”
|About the survey
The survey data is from a sample of 5,774 drivers who providedinformation about their daily driving trips in calendar years 2014and 2015. Respondents were selected from a random sample oflandline and cellphone numbers nationwide.
|Here are 15 key findings from the survey, released on Sept.8:
|
(Photo: iStock)
|1. American drivers travelled nearly10,900 miles on average and spent more than 290 hours on theroad.
Related: Drowsy-driving dangers
||
(Photo: iStock)
|2. More than 87.5 percent of Americans aged 16years and older reported driving in the past year.

(Photo: iStock)
|3. On average, men report driving 2,314 moremiles than women per year and spend 18 percent more time behind thewheel.
Related: 15 new vehicles you should avoid
|
(Photo: iStock)
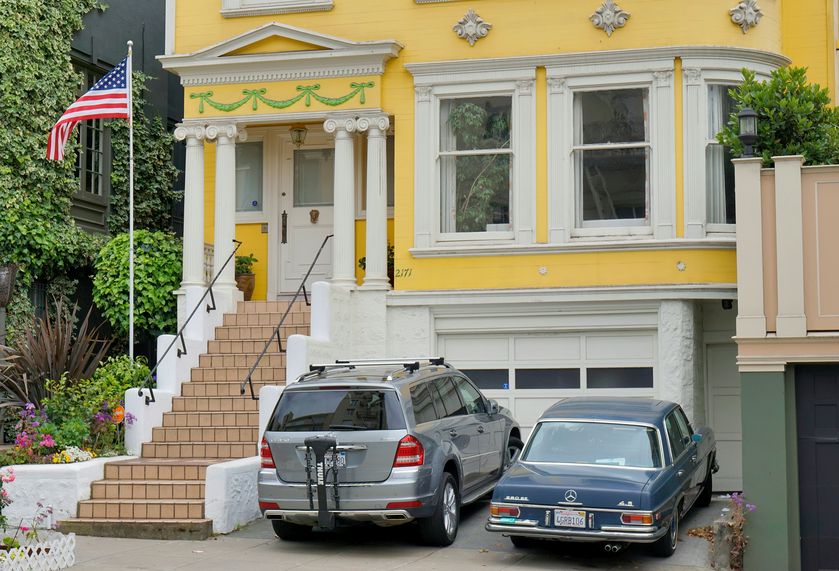
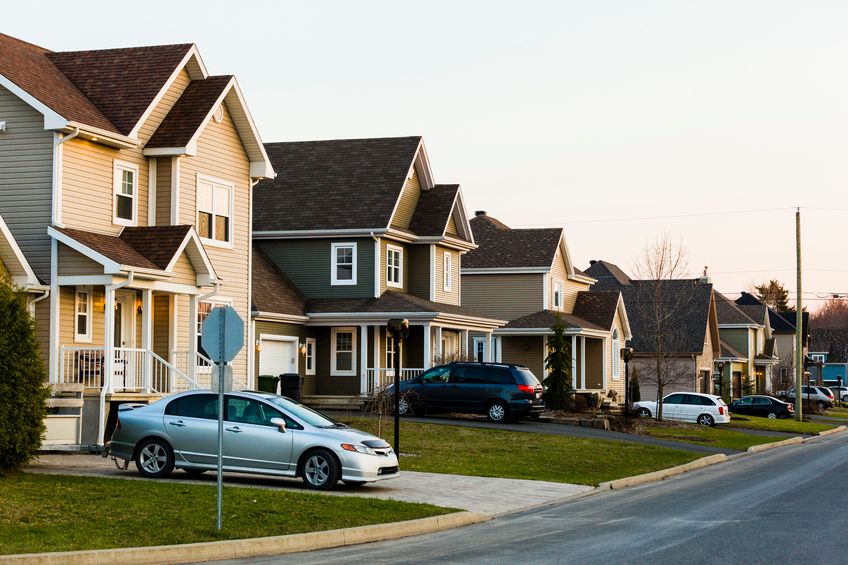
|4. More than 86 percent of U.S.households have at least one car for every driver in the home, and28 percent report having more cars than drivers.

(Photo: iStock)
|5. Seniors over the age of 75 drive fewermiles (5,840 annually) than teenagers (7,551 annually).
Drivers ages 30-49 drive an average of 13,506 miles annually,more than any other age group.
|Related: Here are the 10 least ticketed cars bymodel
|
Vehicles in front of the saloon and dance hall in Winthrop,Washington. (Photo: iStock)
|6. Drivers who report living in ruralareas drive more miles (13,029 annually) compared to drivers wholive in cities or towns (10,571 annually).
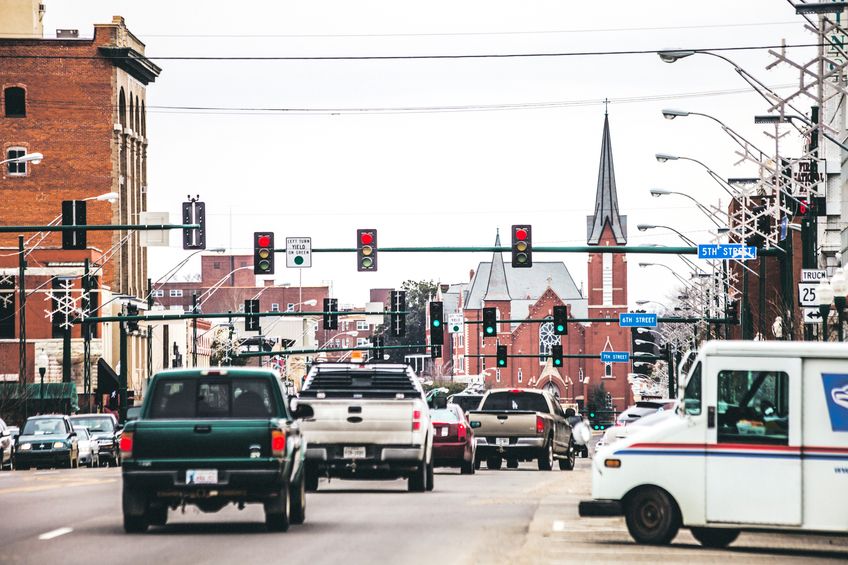
Traffic on city streets in Fort Smith, Arkansas. (Photo:iStock)
|7. Motorists in the Midwest and Southernregions drive more (11,295 miles annually) compared to those in theNortheast (9,328 miles annually).
Related: Vehicle crashes involving road debris haveincreased 40% since 2001
(Photo: iStock)
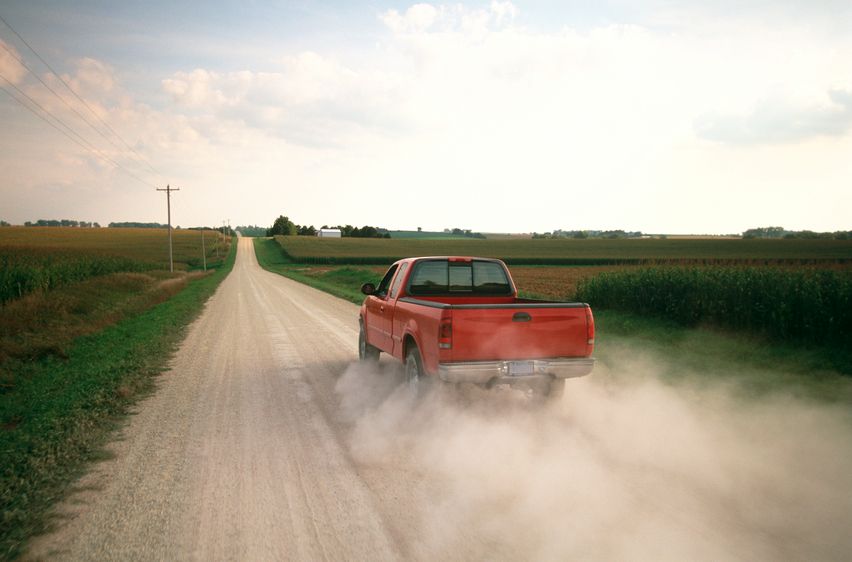
|8. More than 50 percent of miles drivenby Americans are done in cars, followed by SUVs (20 percent),pickup trucks (17 percent) and vans (7.9 percent).
Men report doing a much greater share of their driving in pickuptrucks compared to women who report doing most of their driving incars and SUVs.
|
(Photo: iStock)
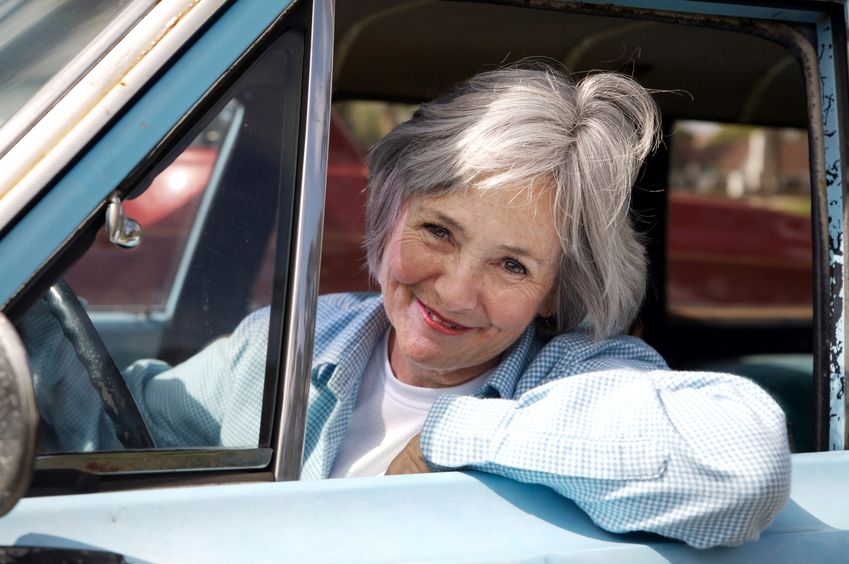
|9. More than 66 percent of total drivingtrips and nearly 62 percent of total miles driven are done bydrivers without a passenger in the vehicle.
Women are 24 percent more likely than men to have a passenger inthe vehicle on any given trip.
|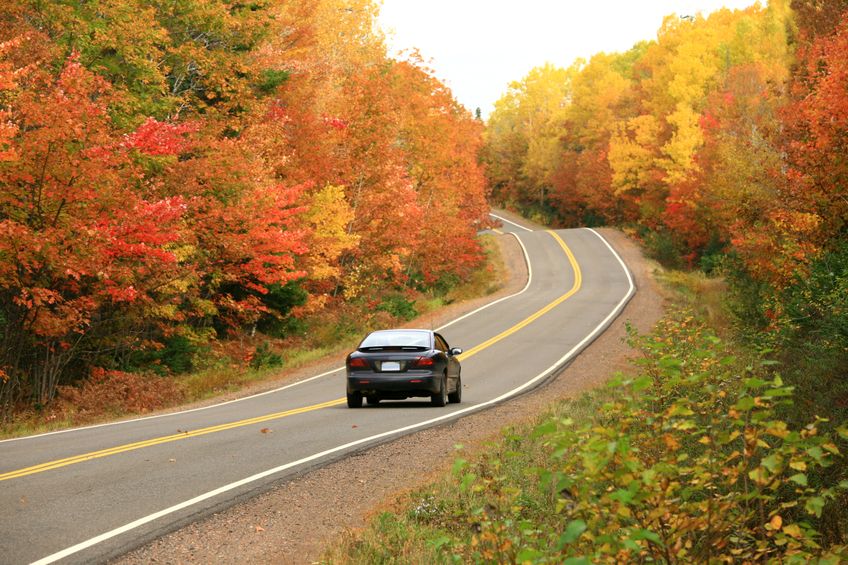
Car driving on a remote Appalachina highway infall. (Photo: iStock)
|10. On average, Americans drive the mostduring the fall (October through December) at 31.5 miles daily anddrive the least during the winter (January through March) at 26.2miles daily.
Related: Look out: There are 160 million angry drivers onthe road
|
(Photo: iStock)
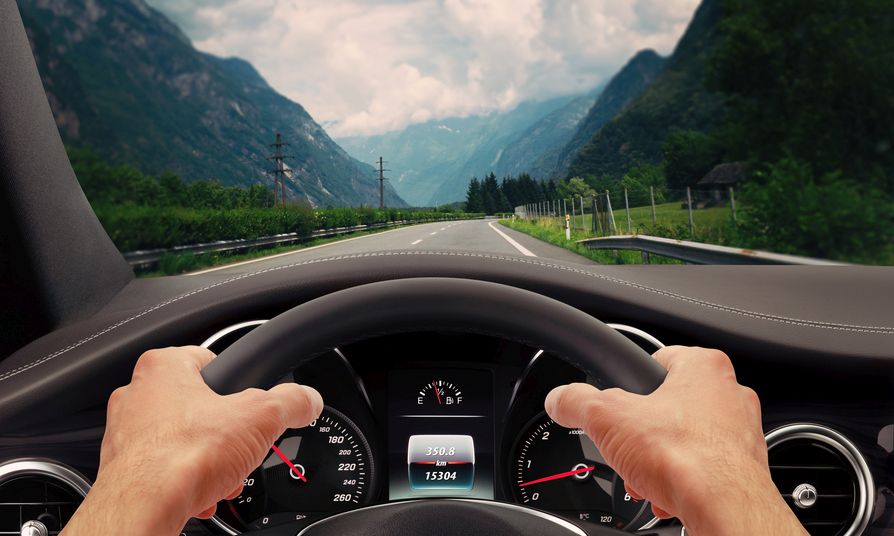
|11. Fewer drivers drove on weekends thanon weekdays.
However, drivers who did drive on the weekend drove more miles,on average, than drivers who drove on weekdays.
|
(Photo: iStock)
|12. Among adults aged 18 and older, thosewho are married were significantly more likely to be drivers thanwere those who were never married or widowed.
Related: 10 states with the highest cost of adding a teen toan auto policy
|
(Photo: iStock)
|13. The average number of drivers perhousehold was 1.8, and the average number of vehicles per householdwas 2.1.

(Photo: iStock)
|14. Overall, drivers reported makingapproximately 2.1 driving trips on any given day, driving anaverage of 29.8 miles and spending an average of 48.4 minutesdriving.
Related: 10 people die every day during the summer from acrash involving a teen driver
|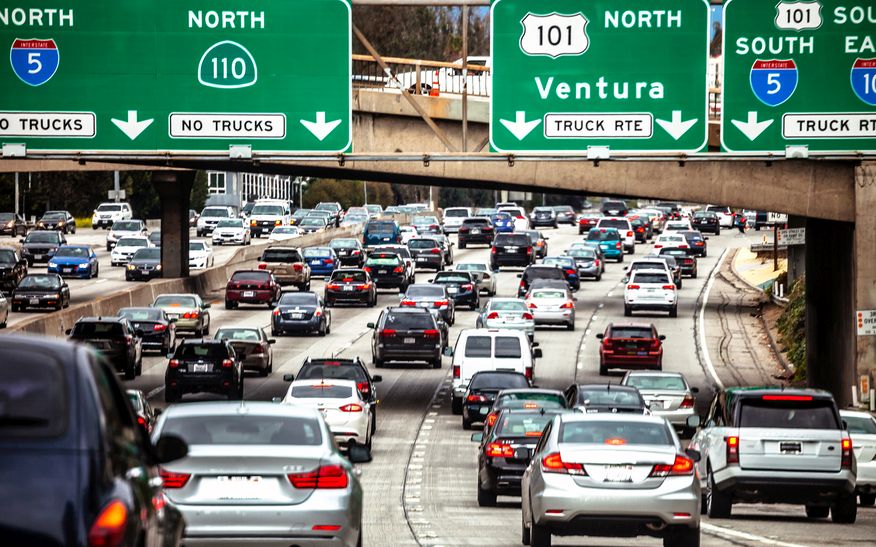
Los Angeles, California traffic in May, 2016. (Photo:iStock)
|15. Data from the U.S. Census Bureau indicates that the driving-agedpopulation increased by approximately 1 percent from 2014 to2015.
As a result, the number of drivers in the United Statesincreased by approximately 3.3 million, or 1.5 percent, from2014 to 2015.
|Here's an infographic from the foundation summarizing theresults of its survey:
|(Click to enlarge.)
||(Source: AAA Foundation for Traffic Safety)
Want to continue reading?
Become a Free PropertyCasualty360 Digital Reader
Your access to unlimited PropertyCasualty360 content isn’t changing.
Once you are an ALM digital member, you’ll receive:
- All PropertyCasualty360.com news coverage, best practices, and in-depth analysis.
- Educational webcasts, resources from industry leaders, and informative newsletters.
- Other award-winning websites including BenefitsPRO.com and ThinkAdvisor.com.
Already have an account? Sign In
© 2024 ALM Global, LLC, All Rights Reserved. Request academic re-use from www.copyright.com. All other uses, submit a request to [email protected]. For more information visit Asset & Logo Licensing.


