Despite high-tech safety features and the increasing ability ofvehicles to protect occupants during a crash, the U.S. is having adeadly year on the nation's roads.
|The National Safety Council (NSC) estimatestraffic deaths are 14% higher through the first six months of 2015than they were during the same period in 2014, and serious injuriesare 30% higher than at the same time last year.
|From January to June, nearly 19,000 people died in trafficcrashes across the U.S., and more than 2.2 million were seriouslyinjured, puttingthe country on pace for its deadliest driving year since 2007.
|$152 billion impact
|Costs also are up. The six-month estimated bill for trafficdeaths, injuries and property damage is $152 billion—24% higherthan 2014. The costs include wage and productivity losses,medical expenses, administrative expenses, employer costs andproperty damage.
|Related: The 9 deadliest driving behaviors, by thenumbers
|"Follow the numbers: The trend we are seeing on our roadways islike a flashing red light–danger lies ahead," said Deborah A.P.Hersman, NSC's president and CEO. "Be a defensive driver and makesafe decisions behind the wheel. Your life really depends onit."
|What's to blame?
|The high death and injury toll could be due to many factors;however, an improving economy with lower gas prices andunemployment rates have brought increases in vehicle milestraveled. According to the Energy Information Administration,average gas prices are 30% lower than they were in 2014 and areprojected to remain relatively stable heading into 2016. Thisgenerally means an increase in traffic as more people can afford todrive, and many travel longer distances and take vacations.
|Cellphone use may also be a culprit. An NSC study earlier thisyear indicated cellphone use is a factor in one quarter of allaccidents.
|Here are the 15 states with the highest percentage increase intraffic deaths from 2014 to 2015 (for the first six months of theyear), according to NSC data.
||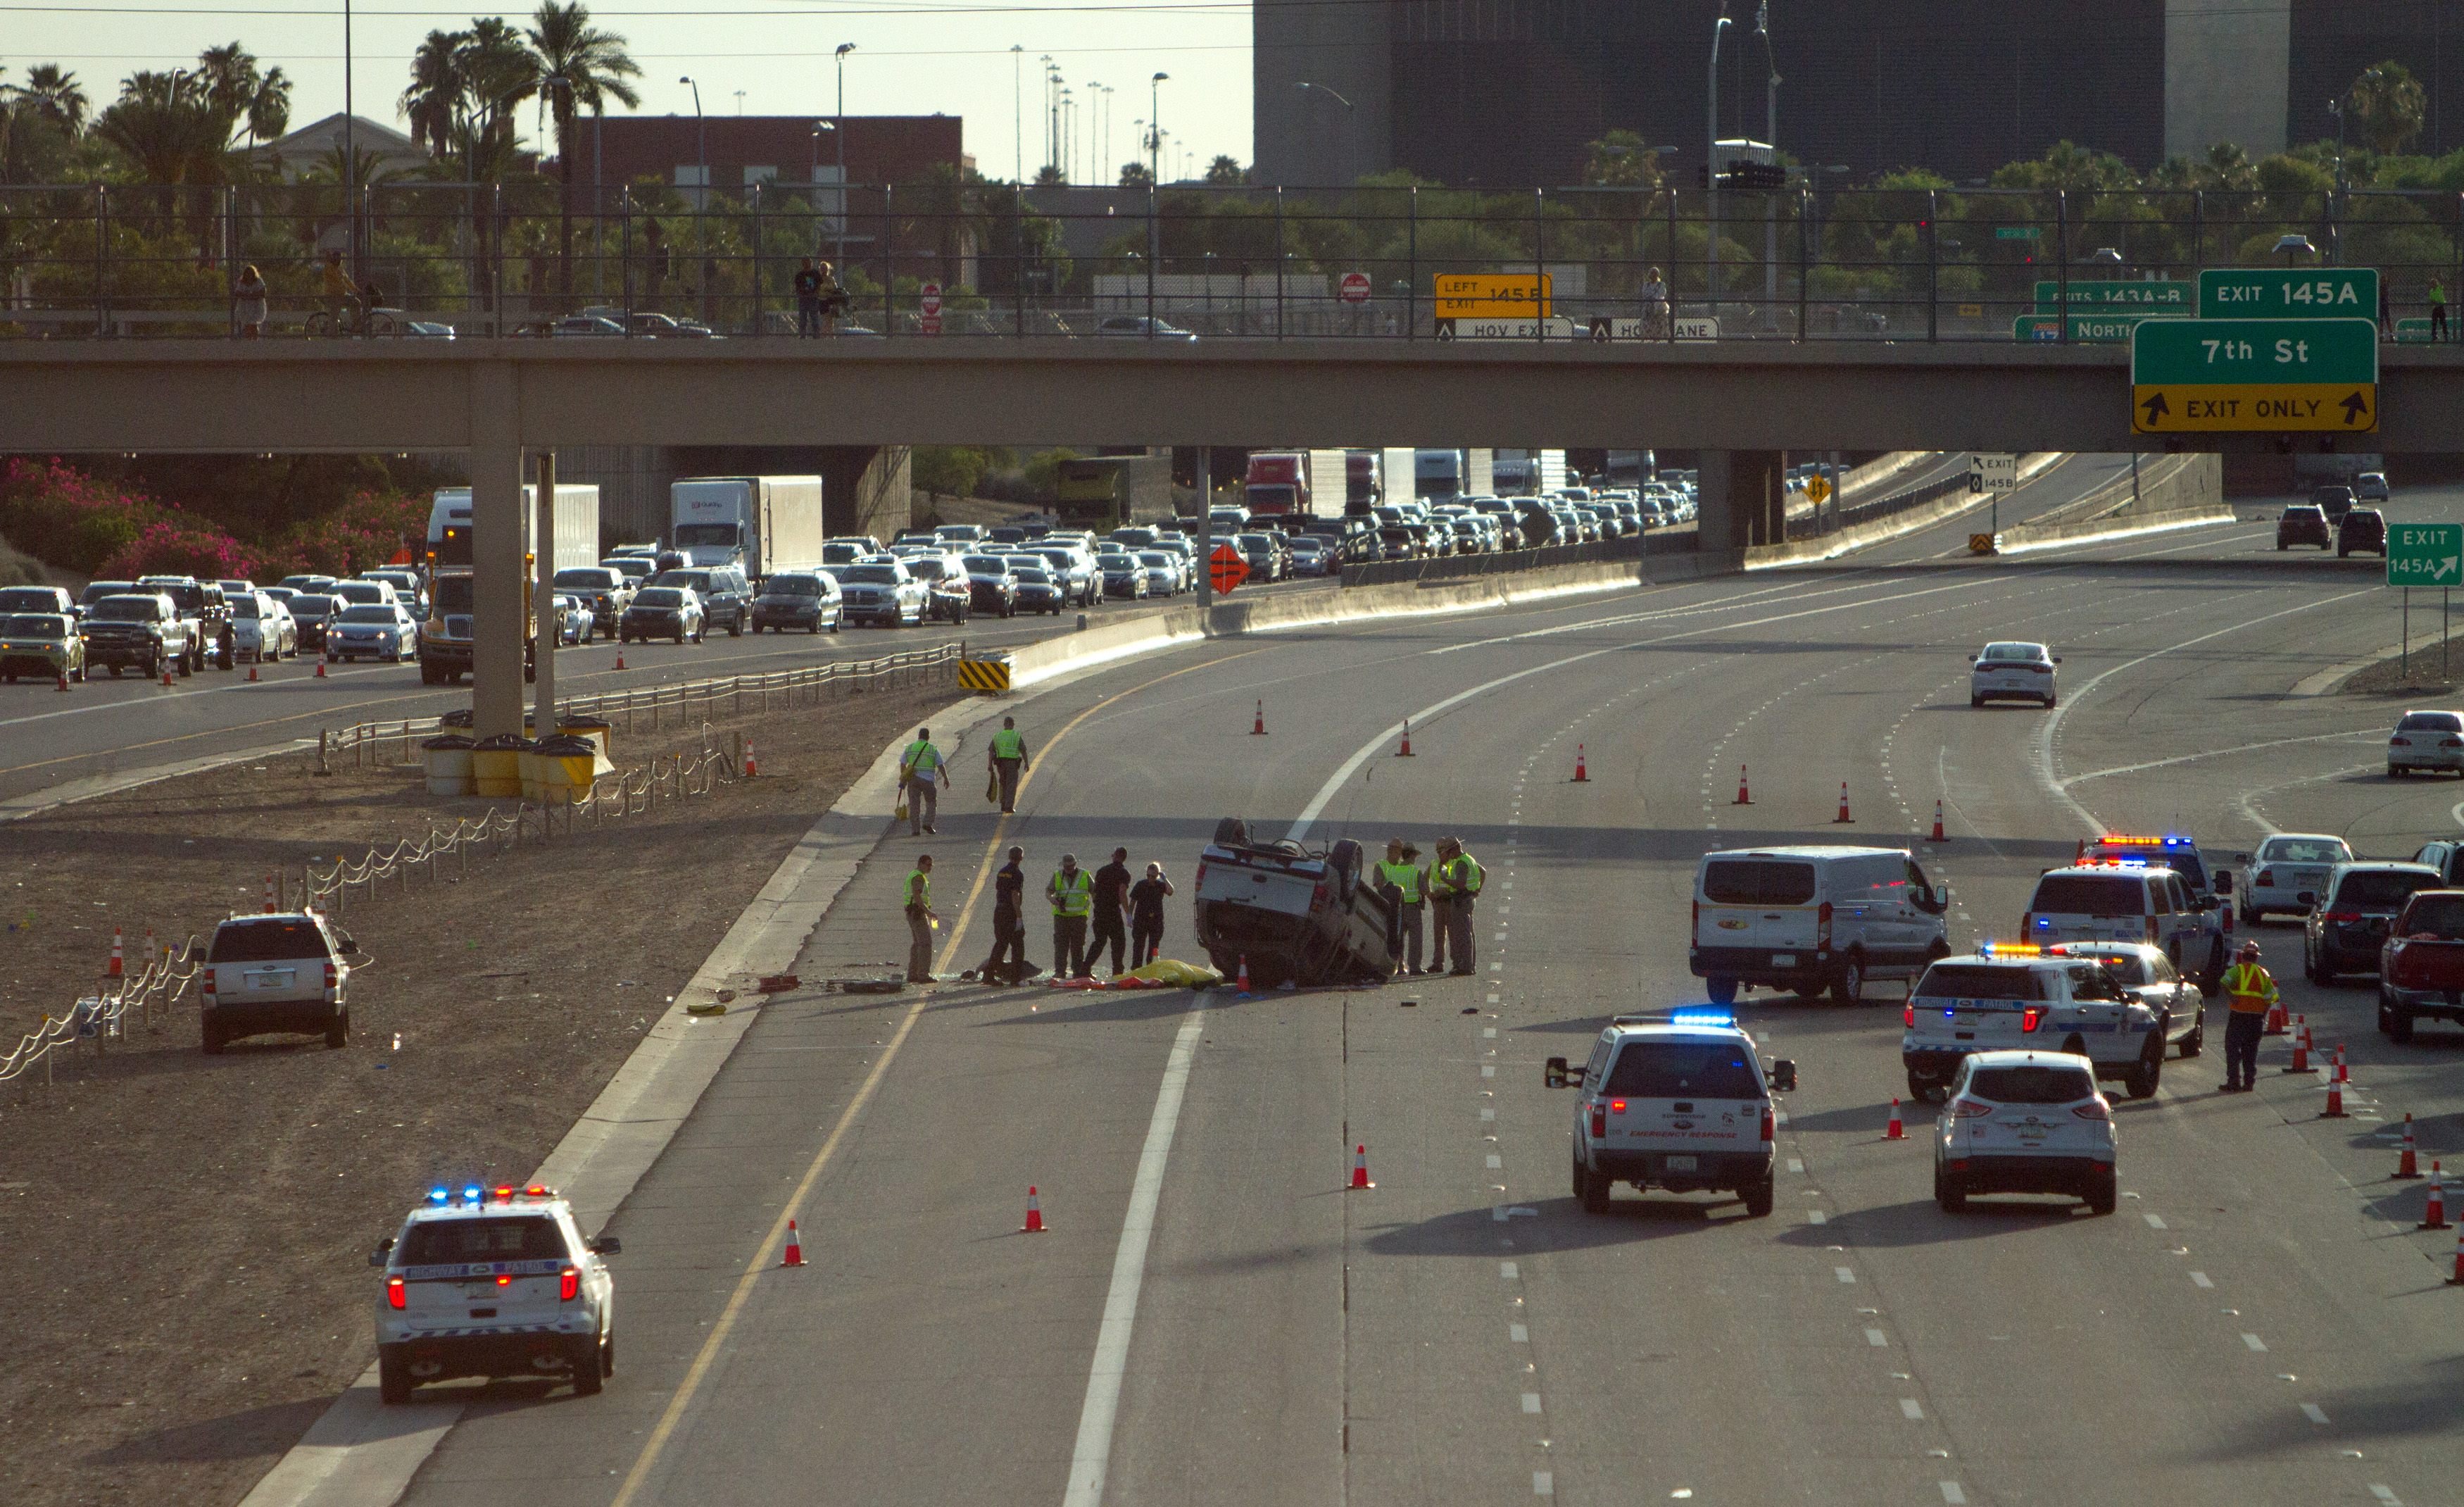
Traffic backs up on Interstate 10 as authorities investigatethe scene of a fatal accident on Sunday, July 26, 2015, in Phoenix.Multiple people were killed in the rollover crash and several wereinjured. (Alonso Parra via AP)
|15. Arizona (tie with Colorado)
|Traffic deaths up 18% over the first six monthsof 2014.
|451 traffic deaths from January 1 through June30, 2015.
||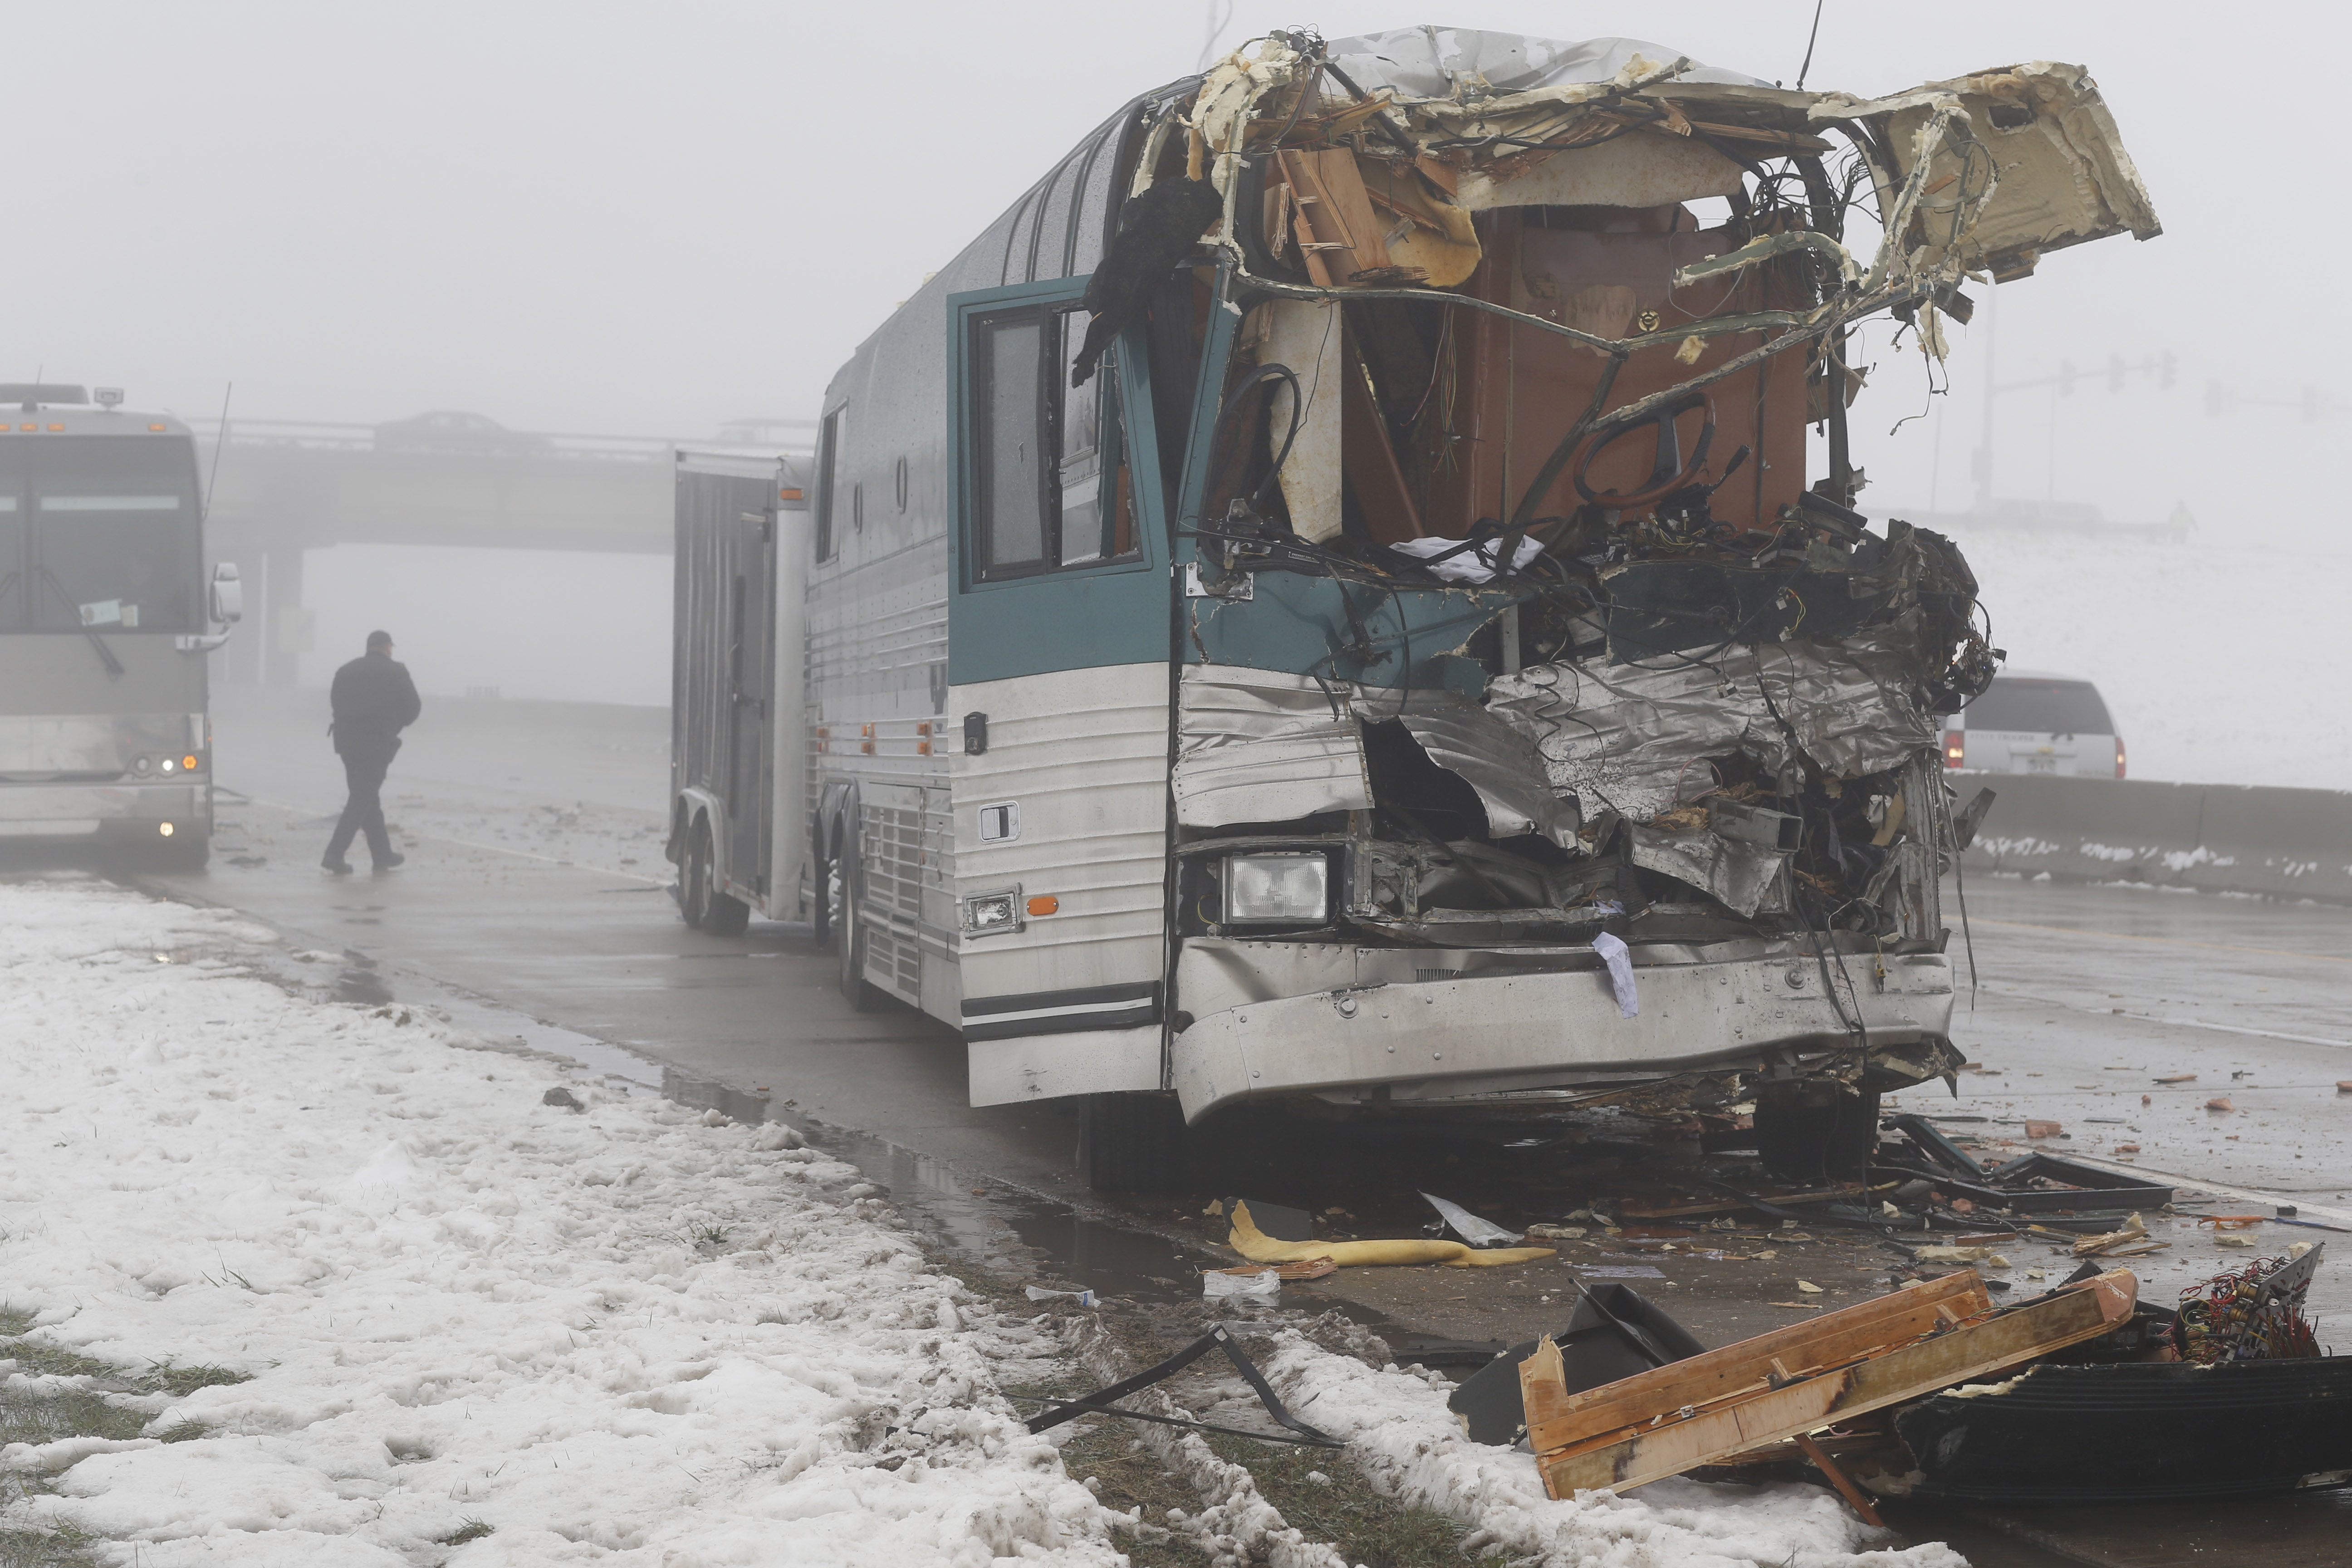
A tour bus involved in an accident with a tractor trailerFriday, April 17, 2015, sits the foreground while the bus that wasfollowing sits behind the wrecked vehicle on the shoulder of thewestbound lanes of Interstate 70 in Aurora, Colo. Officials saythat 12 people were injured, two of them critically, in thefour-vehicle wreck that shut down the highway for several hoursduring a spring storm packing heavy rains and fog. (AP Photo/DavidZalubowski)
|14. Colorado (tie with Arizona)
|Traffic deaths up 18% over the first six monthsof 2014.
|236 traffic deaths from January 1 through June30, 2015.
||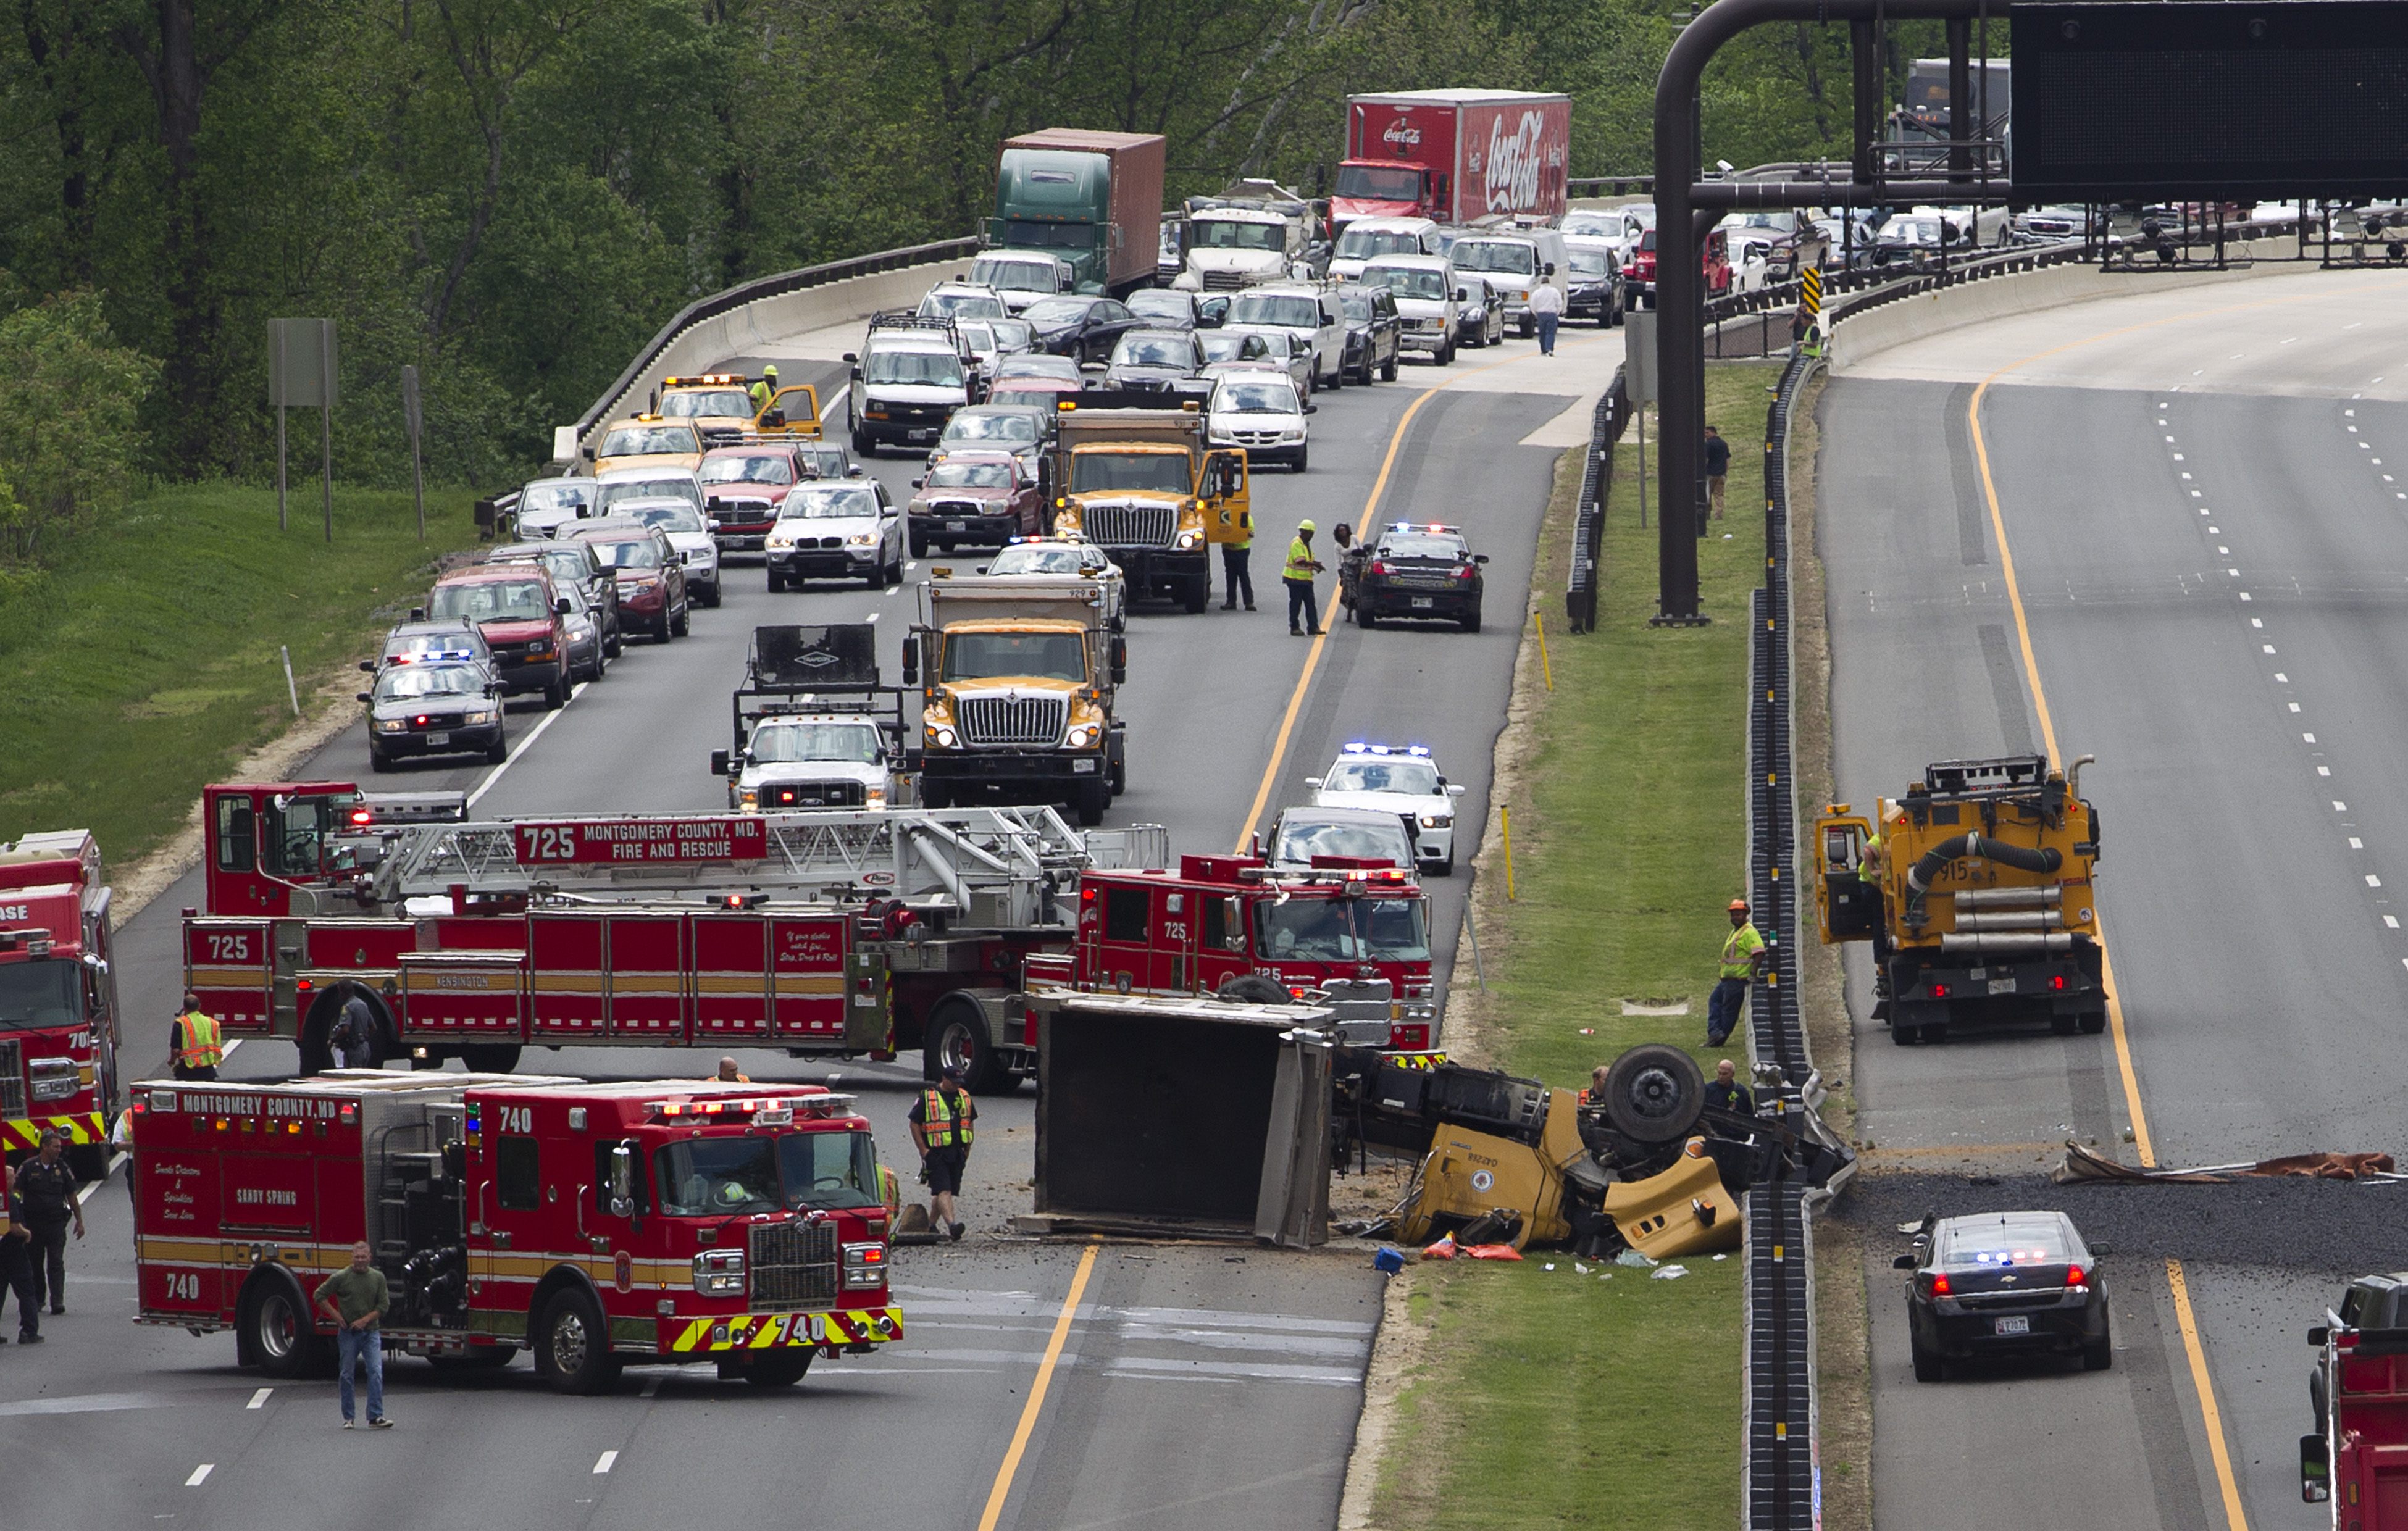
A dump truck crash snarls traffic on the Inter Countyconnector between Layhill Road and New Hampshire Avenue in SilverSpring, Md., Wednesday, May 13, 2015. (AP Photo/Jose LuisMagan)
|13. Maryland (3-way tie with North Carolina andUtah)
|Traffic deaths up 19% over the first six monthsof 2014.
|224 traffic deaths from January 1 through June30, 2015.
||
12. North Carolina (3-way tie with Maryland andUtah)
|Traffic deaths up 19% over the first six monthsof 2014.
|634 traffic deaths from January 1 through June30, 2015.
||
11. Utah (3-way tie with Maryland and NorthCarolina)
|Traffic deaths up 19% over the first six monthsof 2014.
|129 traffic deaths from January 1 through June30, 2015.
||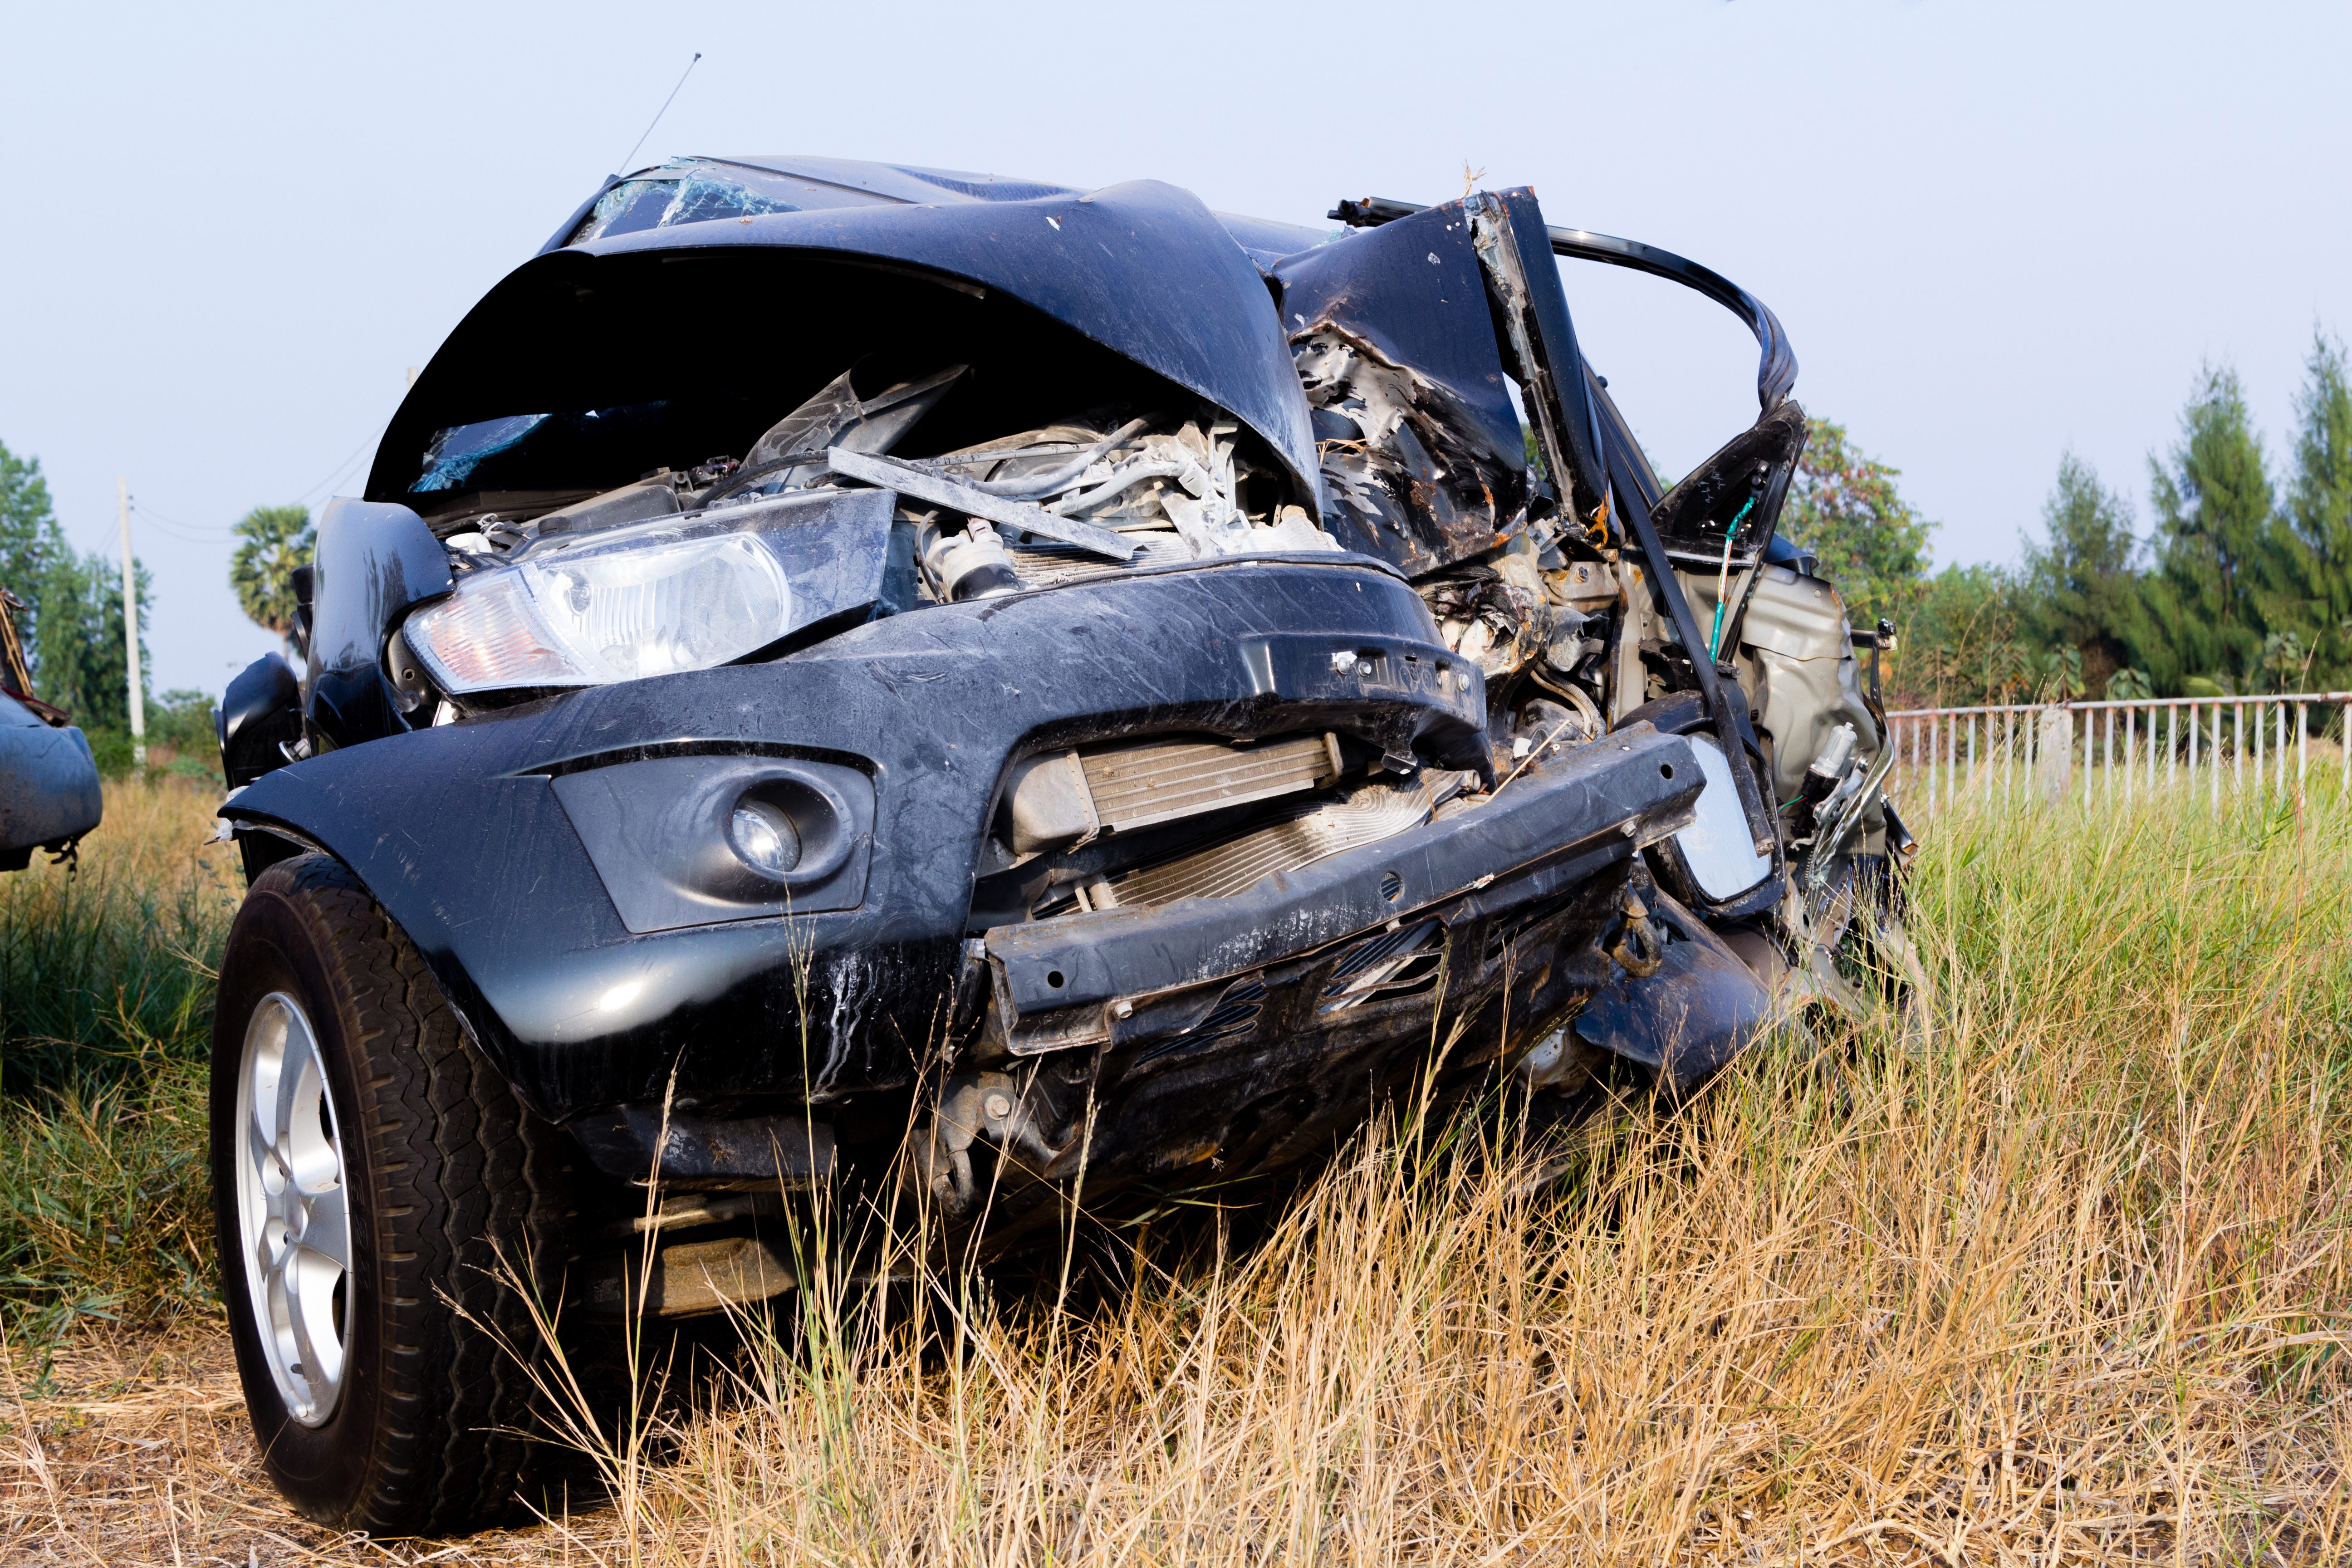
(Photo: Shutterstock.com)
|10. Wisconsin
|Traffic deaths up 19% over the firstsix months of 2014.
|254 traffic deaths from January 1, throughJune 30, 2015.
||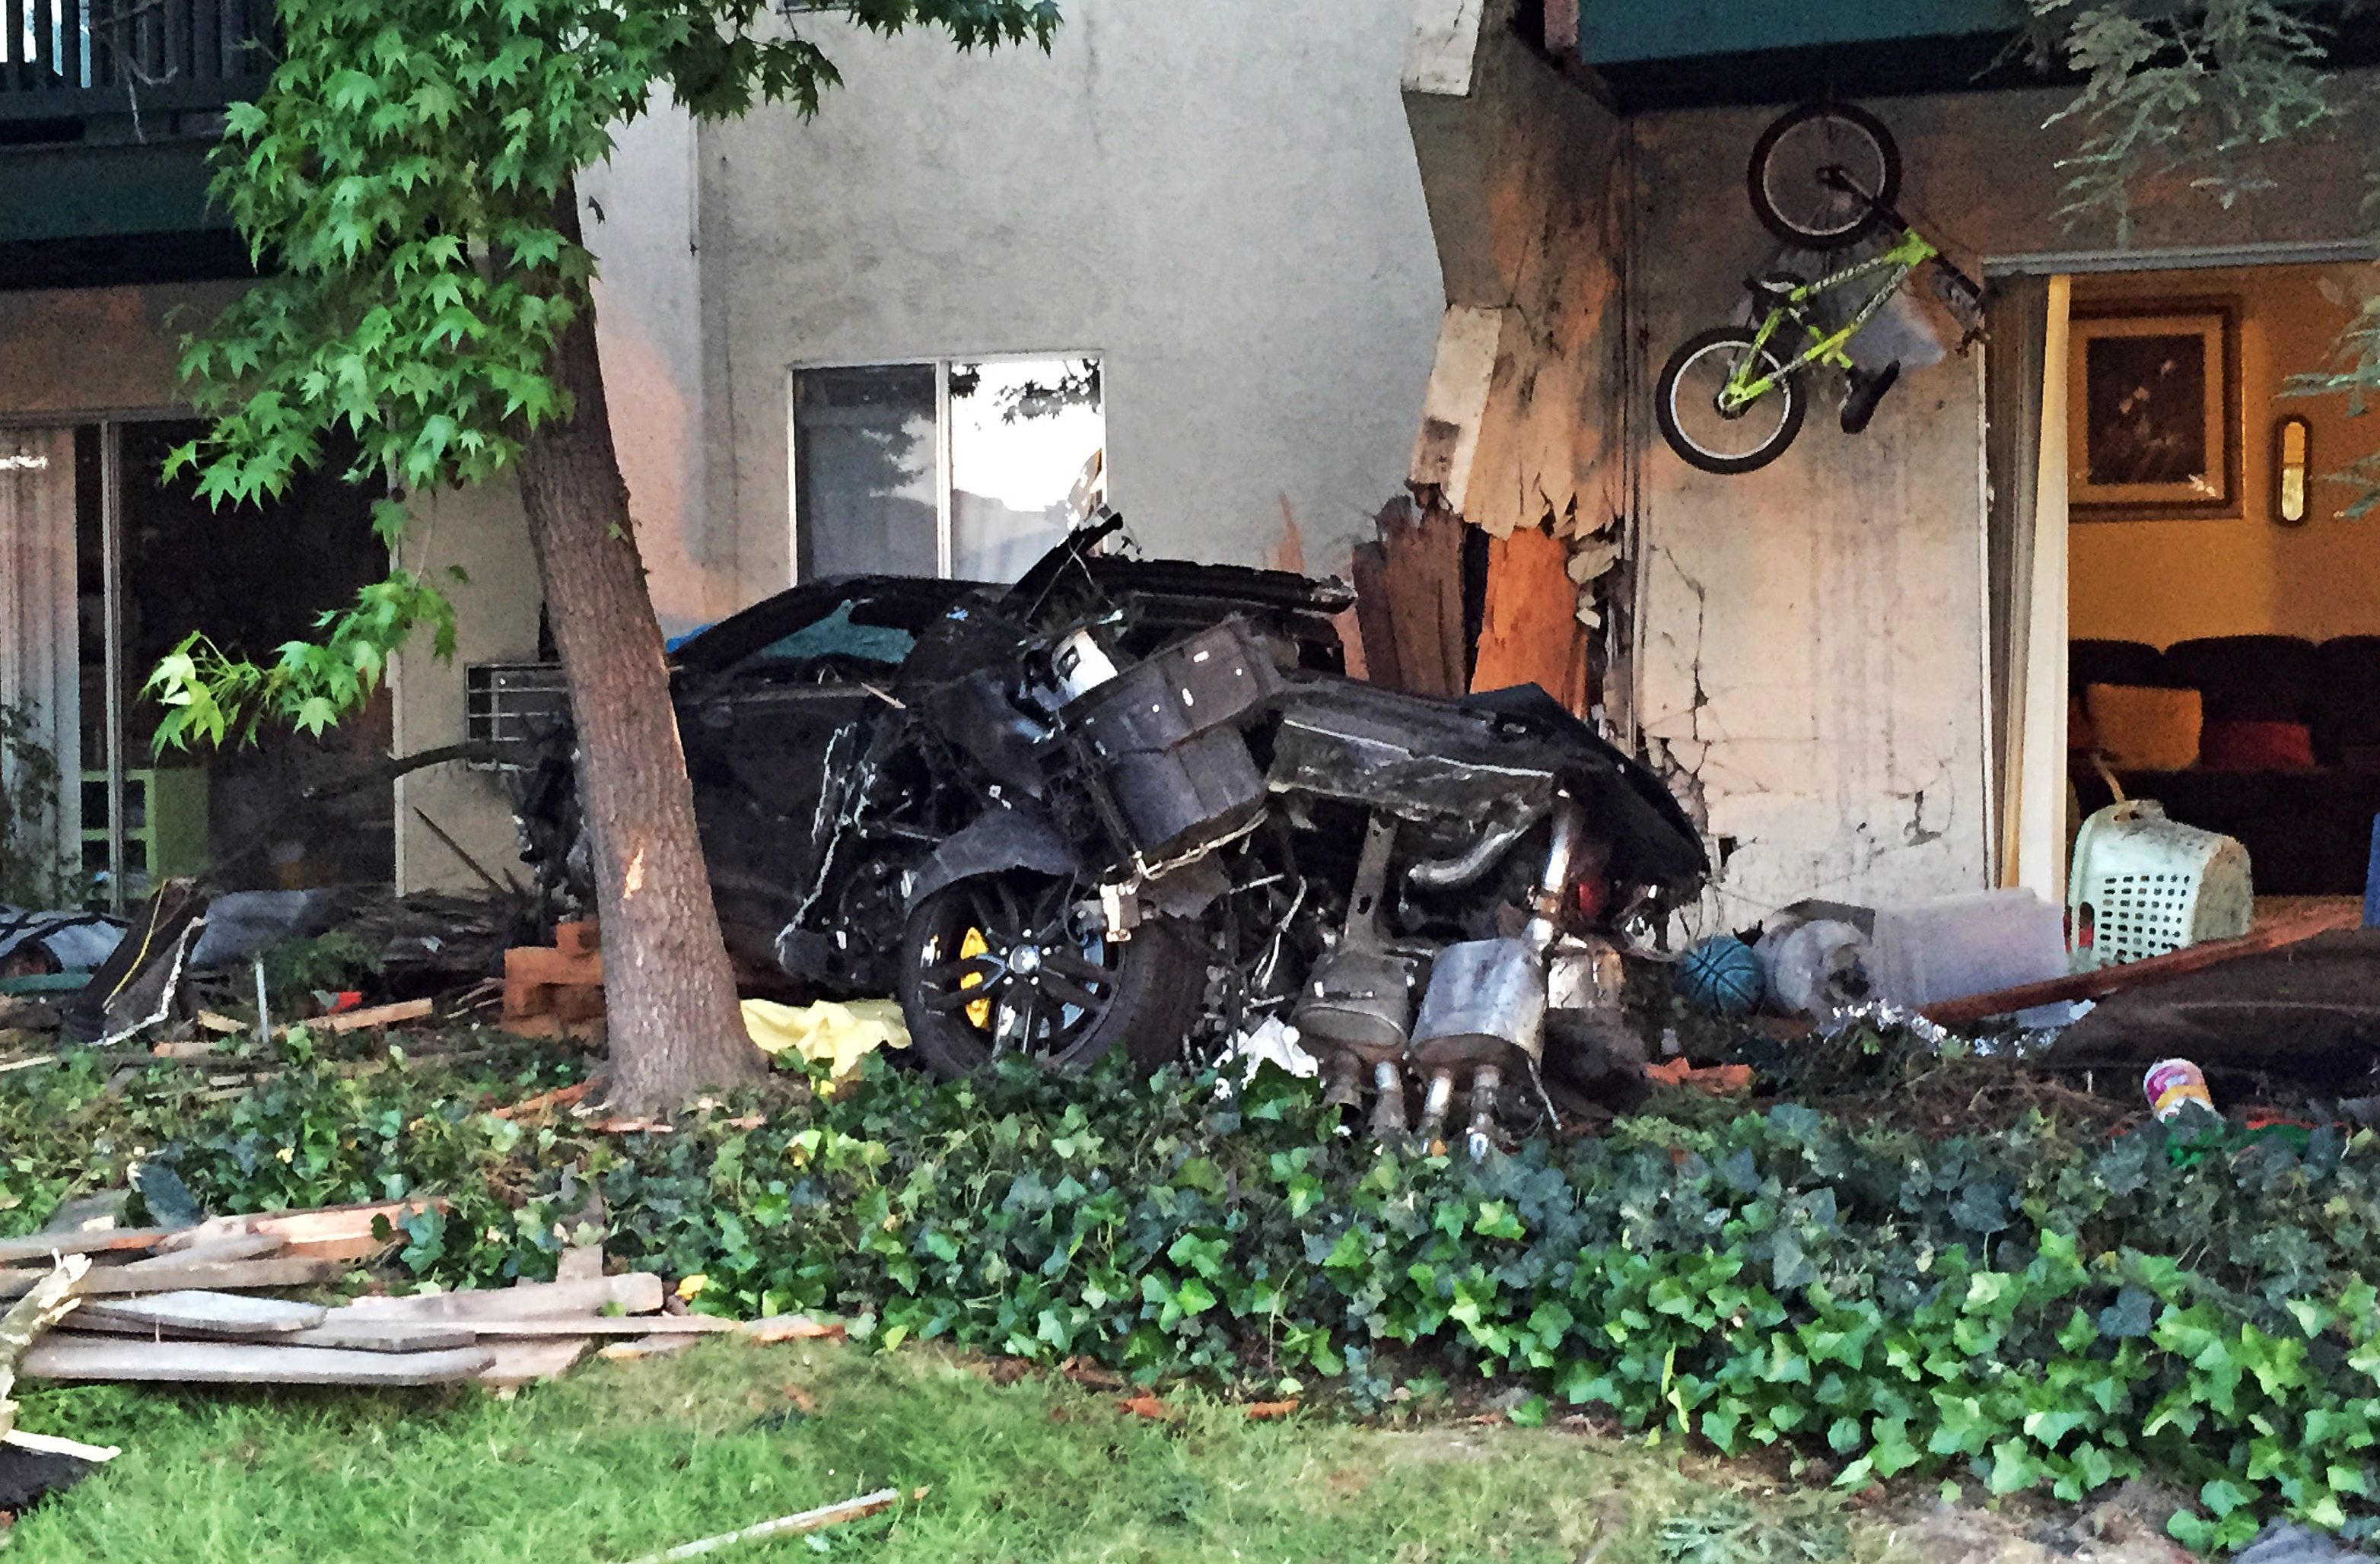
This Saturday, May 2, 2015, photo provided by the Livemore,Calif., Police Department shows the scene after a car crashed intoan apartment complex, killing a woman and toddler and slightlyinjuring two other children, in Livermore in Northern California.Police arrested Brian Jones, of Livermore on suspicion of grossvehicular manslaughter while intoxicated and anotheralcohol-related driving count, Officer Ryan Sanchez said. (RyanSanchez/Livermore Police Department via AP)
|9. California (tie with Wisconsin)
|Traffic deaths up 20% over the first six monthsof 2014.
|1,566 traffic deaths from January 1 throughJune 30, 2015.
|8. Louisiana (tie with California)
|Traffic deaths up 20% over the first six monthsof 2014.
|330 traffic deaths from January 1 through June30, 2015.
||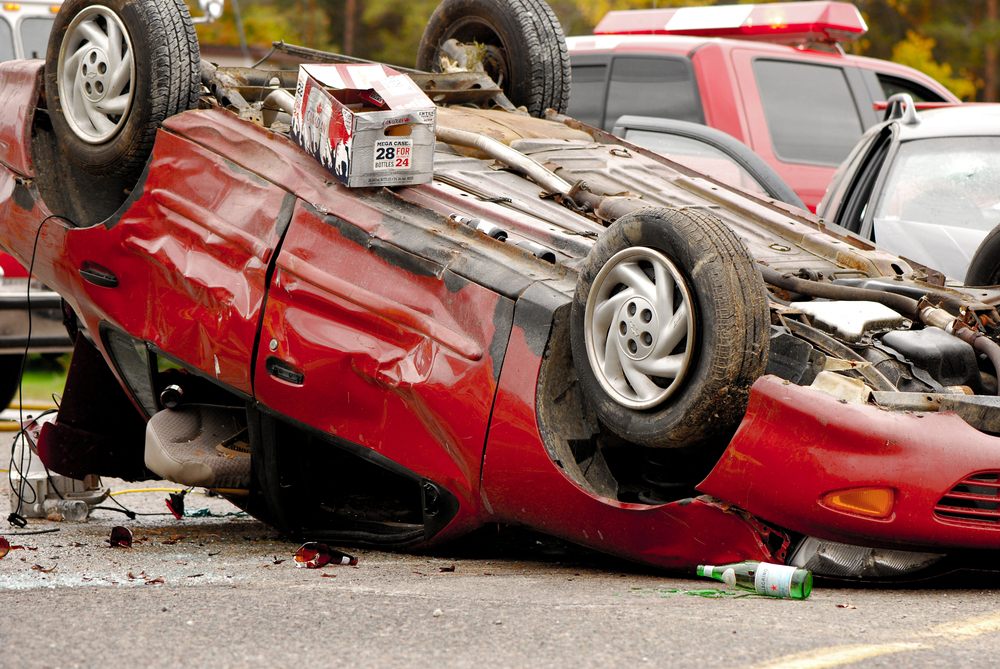
(Photo: Kelly Nelson/Sutterstock.com)
|7. South Carolina
|Traffic deaths up 21% over the first six monthsof 2014.
|445 traffic deaths from January 1 through June30, 2015.
||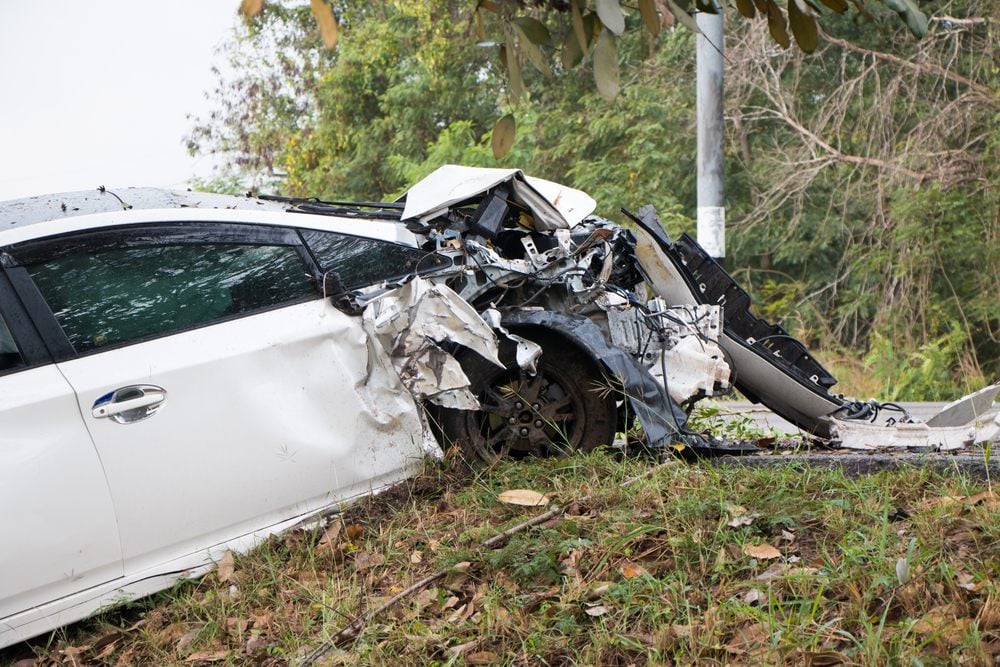
(Photo: Shutterstock.com)
|6. North Dakota
|Traffic deaths up 22% over the first six monthsof 2014.
|61 traffic deaths from January 1 through June30, 2015.
||
(Photo: Shutterstock.com)
|5. Indiana
|Traffic deaths up 23% over the first six monthsof 2014.
|356 traffic deaths from January 1 through June30, 2015.
||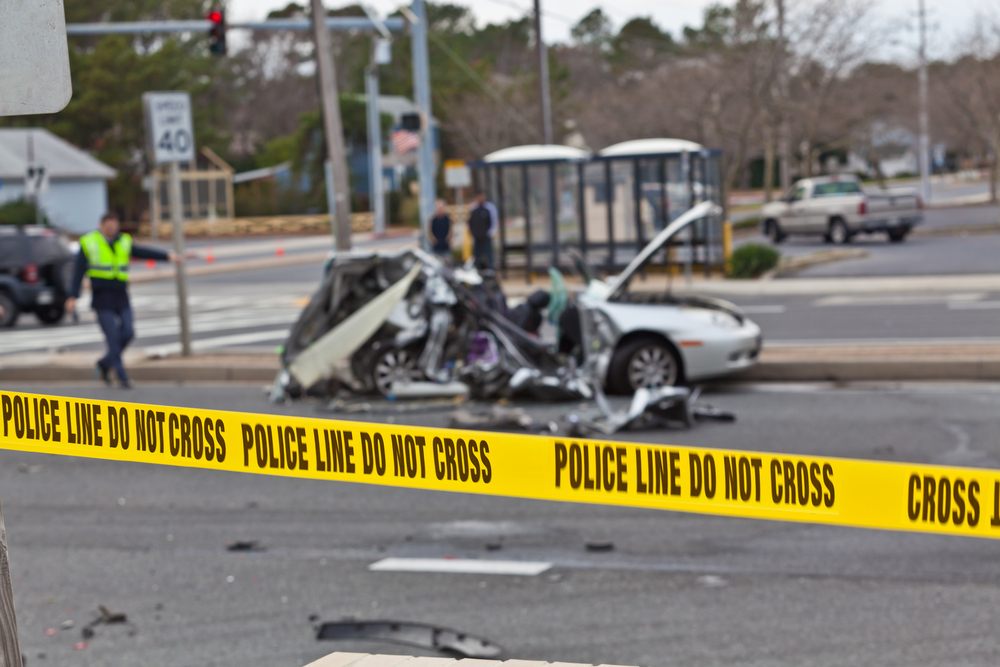
(Photo: Chris Parypa Photography/Shutterstock.com)
|4. Georgia (tie with Minnesota)
|Traffic deaths up 26% over the first six monthsof 2014.
|657 traffic deaths from January 1 through June30, 2015.
|3. Minnesota (tie with Georgia)
|Traffic deaths up 26% over the first six monthsof 2014.
|187 traffic deaths from January 1 through June30, 2015.
||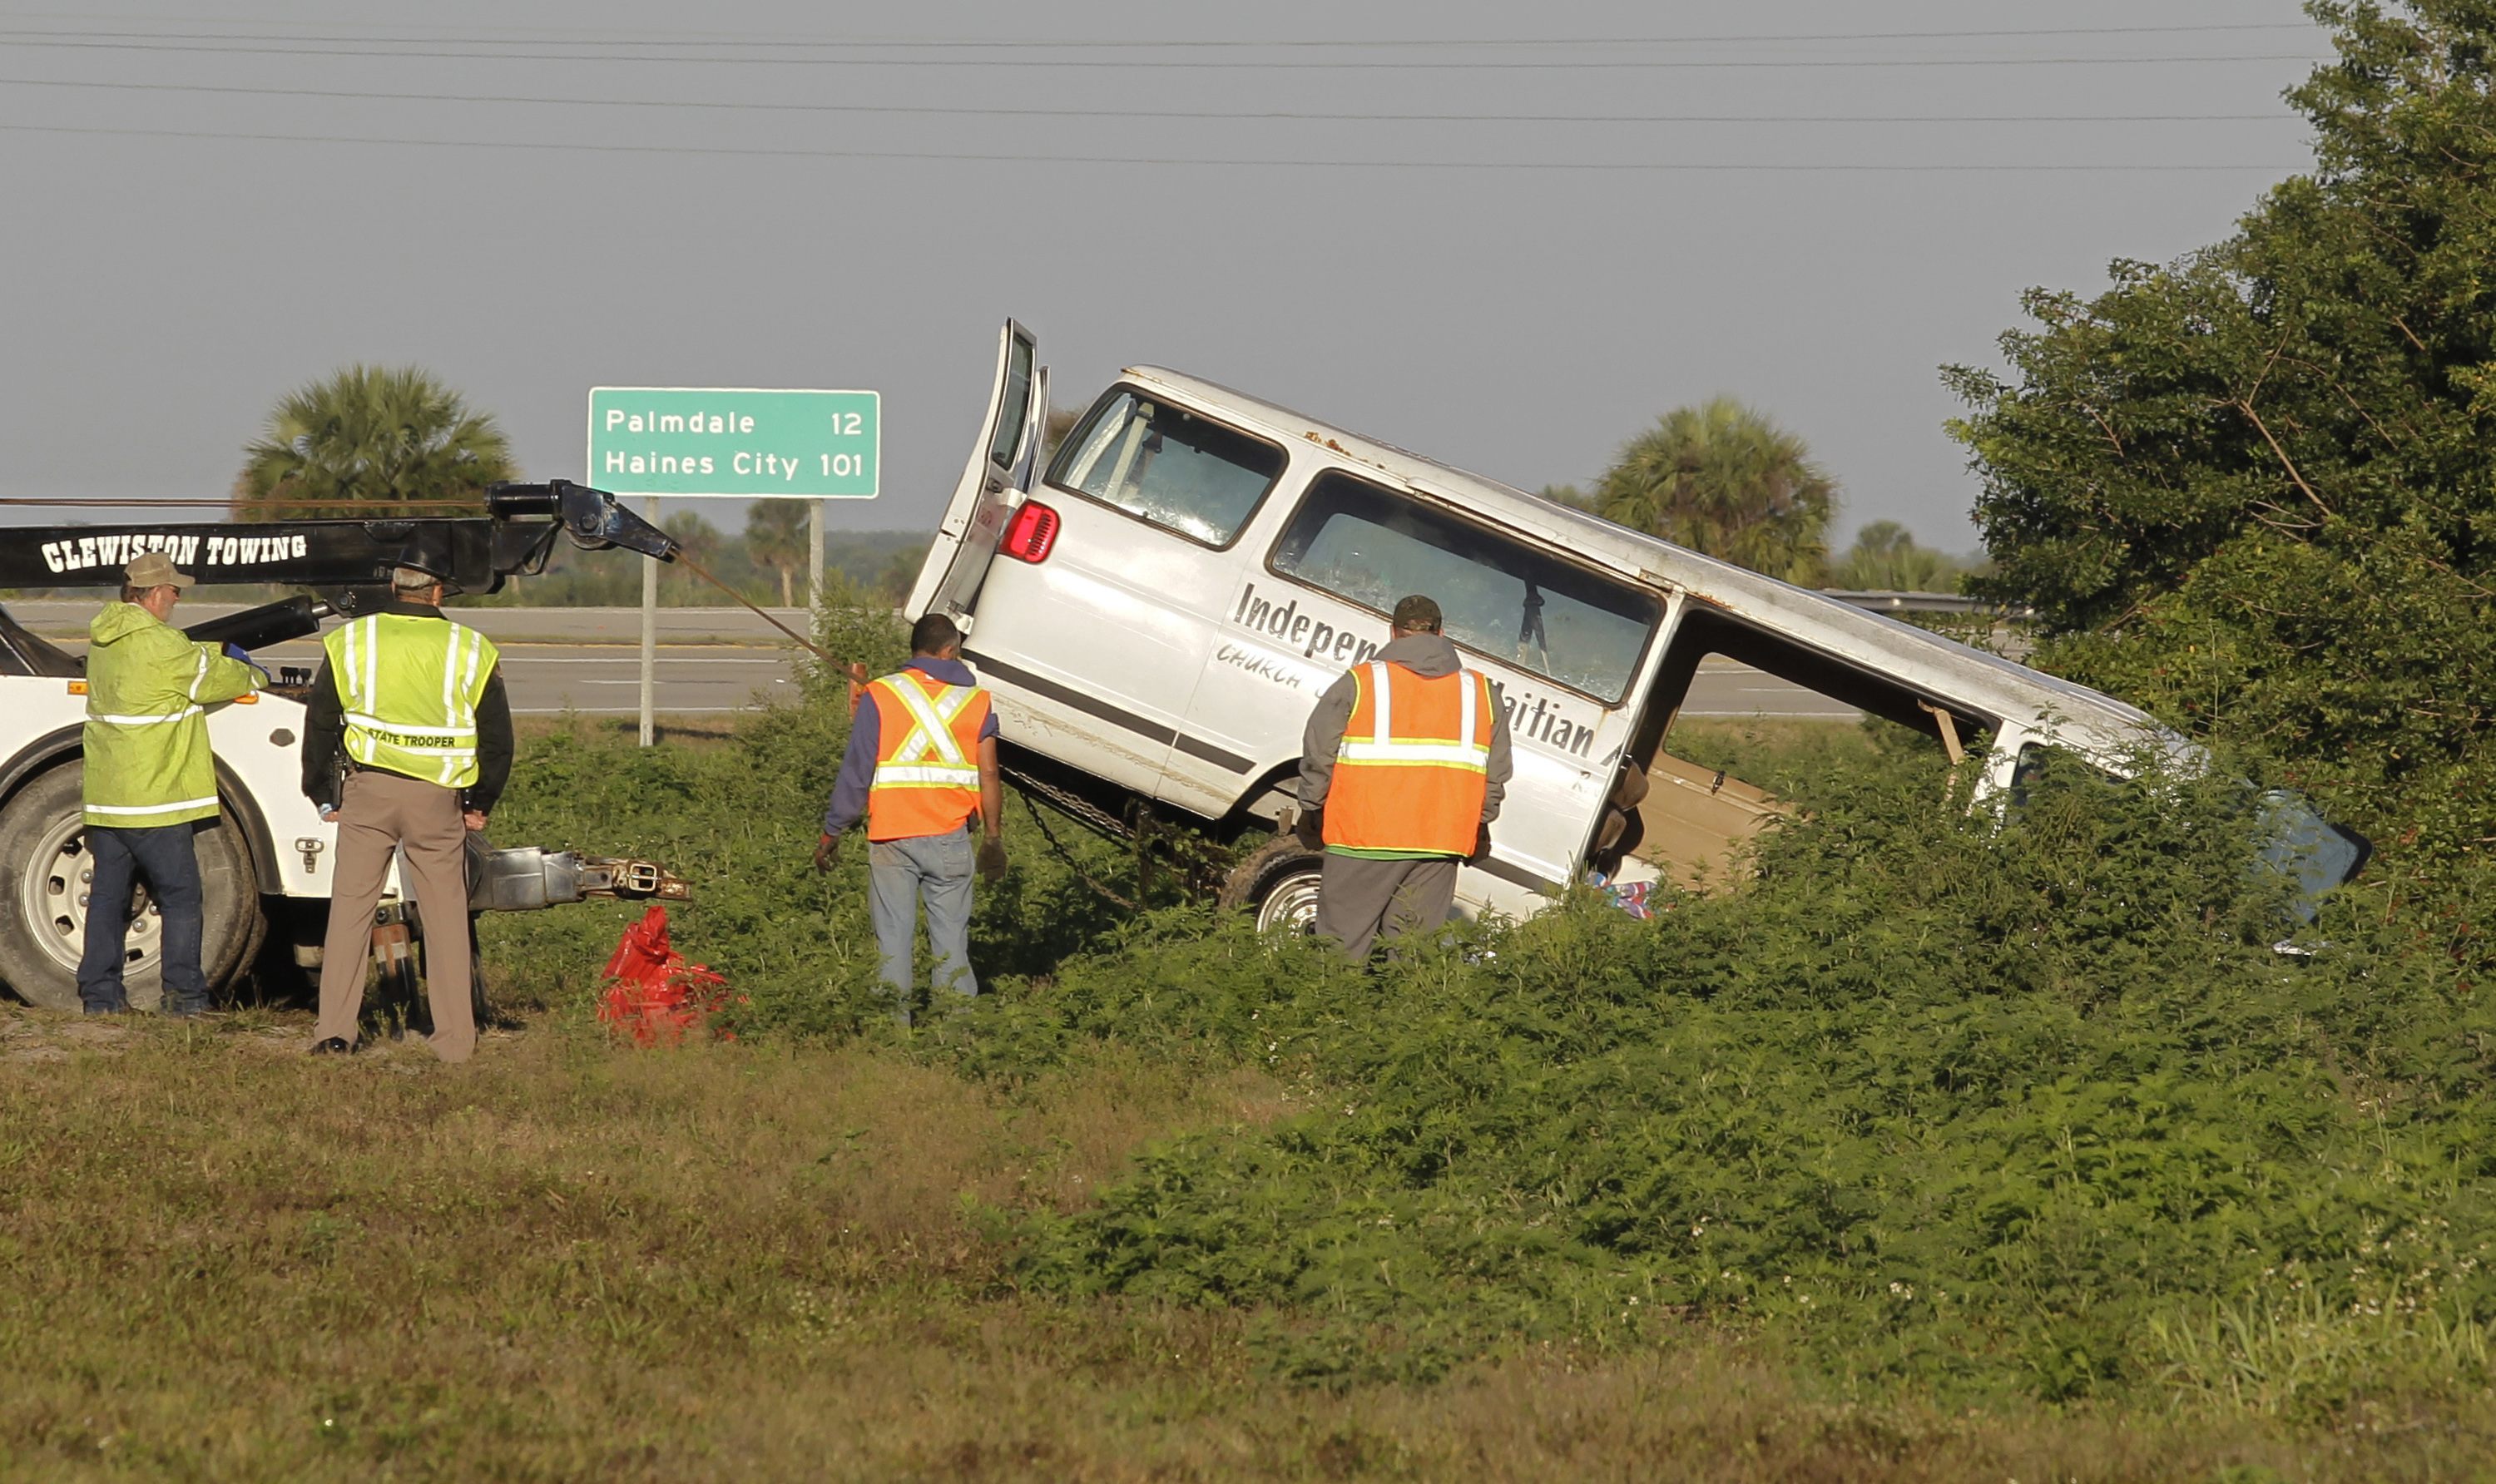
In this March 30, 2015 file photo, workers pull a van out ofa canal at the intersection of U.S. 27 and State Road 78 West, nearMoore Haven, Fla. Federal transportation officials areinvestigating the crash that killed eight members of a Floridachurch who were riding in a type of van that has raised safetyalarms for many years. (AP Photo/Luis M.Alvarez)
|2. Florida
|Traffic deaths up 29% over the first six monthsof 2014.
|1,441 traffic deaths from January 1 throughJune 30, 2015.
||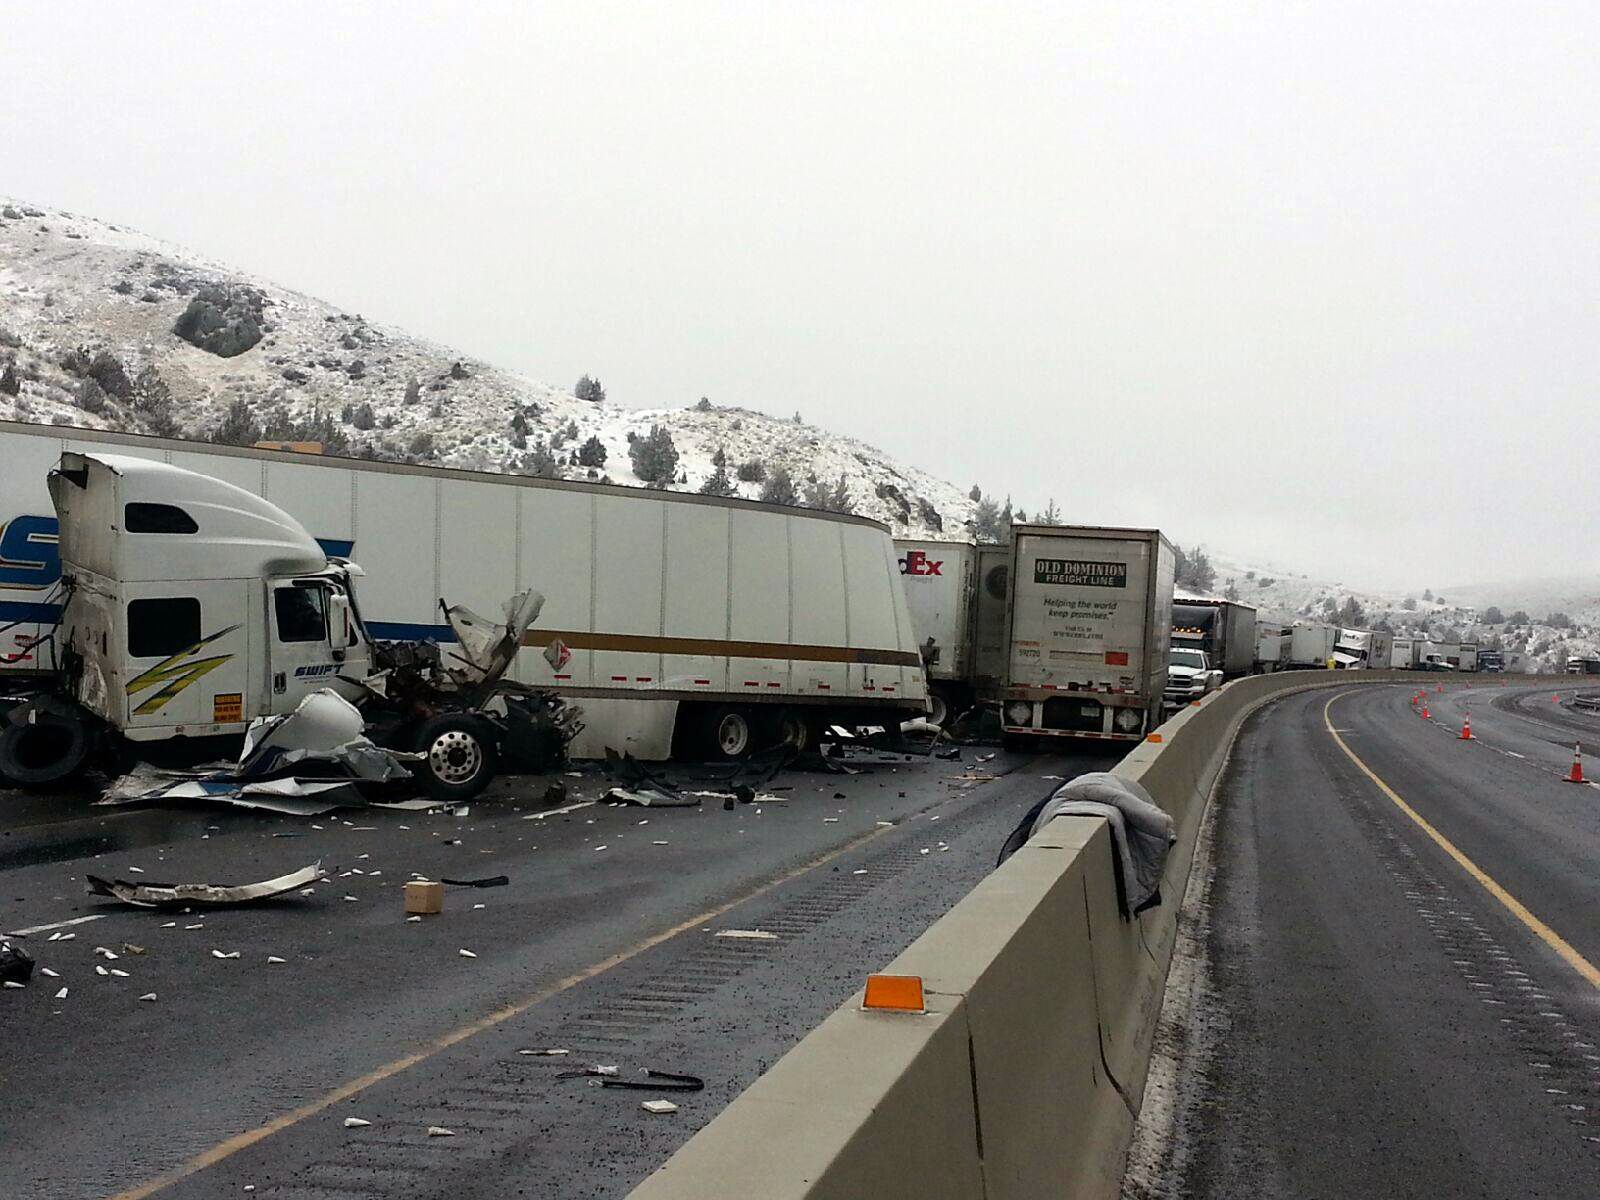
This photo provided by the Oregon Department ofTransportation shows the scene of an accident on I-84 in Oregon onSaturday, Jan. 17, 2015. Black ice is believed to be the cause of afreeway pileup involving more than a dozen tractor-trailersSaturday morning in eastern Oregon, police said. (AP Photo/OregonDepartment of Transportation)
|1. Oregon
|Traffic deaths up 59% over the first six monthsof 2014.
|204 traffic deaths from January 1 through June30, 2015.
|Safety tips
|To help ensure safety, the NSC has the following recommendationsfor drivers:
- Make sure every passenger buckles up on every trip.
- Designate an alcohol and drug-free driver or arrangingalternate transportation.
- Get plenty of sleep and taking regular breaks to avoidfatigue.
- Never use a cell phone behind the wheel, even hands-free.
- Stay engaged in teens' driving habits. Teens are three times aslikely to crash as more experienced drivers.
- Learn about your vehicle's safety systems and how to usethem. My Car DoesWhat can help drivers understand the ins and outsof features such as adaptive cruise control, blind spot warningsystems and backup cameras.
Related: They did what? Distracted driving survey revealswide range of dangerous behaviors
Want to continue reading?
Become a Free PropertyCasualty360 Digital Reader
Your access to unlimited PropertyCasualty360 content isn’t changing.
Once you are an ALM digital member, you’ll receive:
- All PropertyCasualty360.com news coverage, best practices, and in-depth analysis.
- Educational webcasts, resources from industry leaders, and informative newsletters.
- Other award-winning websites including BenefitsPRO.com and ThinkAdvisor.com.
Already have an account? Sign In
© 2024 ALM Global, LLC, All Rights Reserved. Request academic re-use from www.copyright.com. All other uses, submit a request to [email protected]. For more information visit Asset & Logo Licensing.


