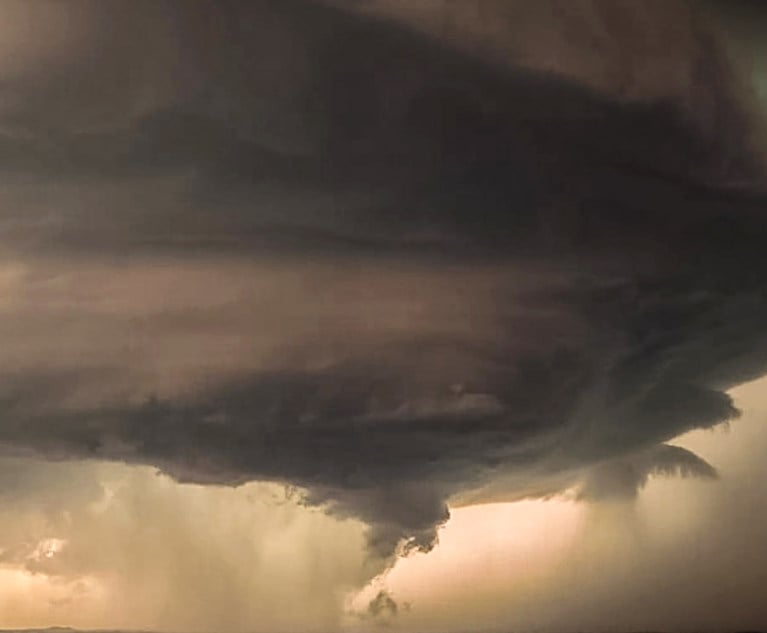
The U.S. continues to experience severe weather events ofescalating magnitude and frequency. As a result, damaging winds,tornadoes, and hail storms are impacting a larger swath ofthe nation, in turn driving up personal and commercialproperty claims, among other things.
|During the past 2 years, hail-related damage claims jumped84 percent, based on findings released todayfrom the latest National Insurance Crime Bureau (NICB)ForeCAST report. When analyzing hail loss claims filedfrom January 1, 2010 through December 31, 2012, the NICB countedmore than 2 million. When broken down byyear, there were 467,602 hail damage claims filed in 2010,followed by 689,267 in 2011, and then 861,597 in 2012.
|Hail Claims Up 84% on More Frequent, Severe Storms
|Member companies referred a portion of these hail lossclaims to NICB for closer inspection because ofcertain characteristics that might indicate anything frominflated damages to outright deception. What were themost common referral reasons, andwhich states reported the most hail damage overall? Findthe answers and learn about other trends theNICB uncovered by clicking “Next”at the bottom right.
||
6. Outbreak of More Severe Storms
|Mother Nature proved to be a formidable mistress, battering theU.S. with numerous hail events that produced extensivedamage, leading to a barrage of personal andcommercial claims. The NICB identified a total of 2,018,466hail-related damage claims with a loss date from January 1,2010 through December 31, 2012.
|During this two-year period, the largestnumber originated in Texas,which generated a total of 320,823 hail loss claims. In 2010,2011 and 2012, Texas saw 557, 741 and 795 hail events,respectively. (Claims activity follows the hail storm activity asposted on the National Weather Service's Storm Prediction Center).
|
(Texas storms, AP photo/Mike Fuentes)
|5. Hail is BIG in Texas
|Trailing behind the Lone Star State for the most hail lossclaims from 2010 to 2012 is Missouri, with138,857 and Kansas, with 126,490. Alsorounding out the list of the Top 10 states with the largestcombined total of hail loss claims are Colorado (118,118); Oklahoma(114,168); Illinois (107,772); Tennessee (92,253); Indiana(91,054); Arizona (88,456); and Kentucky (77,839).
|These ten states represent 63 percent of thetotal hail loss claims. Texas accounted for 16 percent of thetotal claims during the specified timeframe.
||
4. Seasonal Differences
|Most hail loss claims sprout up in the spring and summer months,between March and July. This is likely due to increased numbers ofthunderstorms during this time period, the NICB noted. Researchperformed at the NOAA supports these findings. Between 2010and 2012, NOAA hail reports were found to be most numerous inApril, May, and June, which is reflected in the monthly averages ofhail loss claims.
||
3. QC Referrals Up Slightly
|Despite the overwhelming rise in hail-related damage claimsoverall, the number of related QCs submitted to NICB for closerinspection was more subtle. In total, 3,829 QCs, designated with aloss type of “hail,” were reported between January 1, 2010 andDecember 31, 2012. Hail loss QCs decreased 4 percent between 2010and 2011, then increasing 4 percent between 2011 and 2012. Onceagain leading the way, Texas was the state with the largestcombined total of hail loss QCs, followed by Illinois, Colorado andArizona. The top ten states on the list represented 76 percent ofthe total hail loss QCs during the 2010-2012 timeframe. Forinstance, Texas reported 1,053 QCs, or 28 percent of the totalnumber of QCs between January 1, 2010 and December 31, 2013.
||
2. Homeowners Under Suspicion
|Of the top five policy types identified in hail loss QCsfrom 2010 through 2012, “personal propertyhomeowners” (PPHO) raised the most eyebrows, with2,546 total QCs. This represented 66 percent of the totalnumber of hail loss QCs. The remaining four policy types (indescending order in terms of total QCs) are personal auto (PAPP);personal property/fire (PPFR); personal property/other (PPOP); andcommercial property (CPMP).
||
1. Deceptive Appearances
|Typical property damage from hail events can be as minimal as afew broken shingles or can amount to the decimation of multiplebuildings. Such a wide range can present the adjuster with uniquechallenges when making complex damage assessments. It canalso open the door to deception, from “soft” fraud to outrightdeceit.
|Of course, the fact that a claim has been referred to NICB doesnot automatically indicate fraud or malcontent on the partof a policyholder or vendor. While each QC must have atleast one referral reason listed, it may contain as manyas seven reasons.
|For hail-related QCs submitted from 2010 to 2012, the mostcommon referral reasons were:
- Hail damage
- Vendor fraud
- Catastrophe – hurricane, tornado, hail, wind, or fire
- Prior loss/damage
- Inflated damage
Files referred to NICB for “hail damage” accounted for 3,187QCs.
|Want to continue reading?
Become a Free PropertyCasualty360 Digital Reader
Your access to unlimited PropertyCasualty360 content isn’t changing.
Once you are an ALM digital member, you’ll receive:
- All PropertyCasualty360.com news coverage, best practices, and in-depth analysis.
- Educational webcasts, resources from industry leaders, and informative newsletters.
- Other award-winning websites including BenefitsPRO.com and ThinkAdvisor.com.
Already have an account? Sign In
© 2024 ALM Global, LLC, All Rights Reserved. Request academic re-use from www.copyright.com. All other uses, submit a request to [email protected]. For more information visit Asset & Logo Licensing.


