

|
The 2012 edition of the National Council on CompensationInsurance's (NCCI) annual State of the Line report, evaluatingWorkers' Compensation fundamentals and conditions, reveals a marketcharacterized by a number of countervailing indicators as to itsforward trajectory.
|In some ways, we are seeing improved conditions in the Workers'Comp space over previous years; by other measures, the marketremains in a worrisome state.
|
PARSING THE NUMBERS
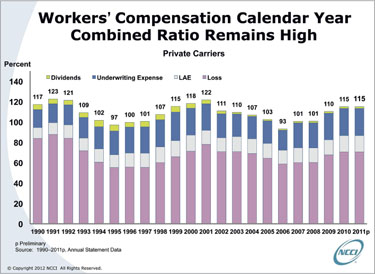
|For the third straight year, Workers' Comp holds the dubiousdistinction of having the highest combined ratio of all of themajor commercial lines: 115 in 2011, the same number as in2010.
|It is important to remember that the 2010 number was influencedby the fact that one carrier had significantly strengthened itsexcess Workers' Comp reserves, adding three points to the combinedratio for 2010.
|Without that strengthening, the combined ratio would have been112. Since there appeared to be no excess Workers' Compreserve-strengthening in 2011, that 115 combined ratio may actuallybe viewed as a further deterioration.
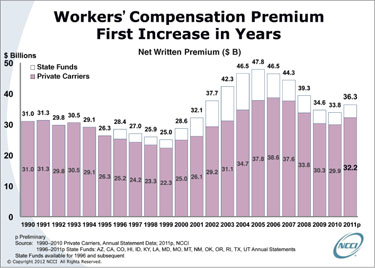
|Because of its direct connection to employment and the labormarkets, Workers' Comp has been the P&C sector mostsignificantly impacted by the Great Recession. As a whole, the line(including state funds) experienced a drop of more than 25 percentin premium between 2006 and 2010, coupled with more than a 20-pointincrease in combined ratio over the same time period.
|However, in 2011 net written premium increased by 7.4 percent to$36.3 billion. This boost is the first since 2005, and it is awelcome shift following the cumulative 27-percent decline inpremium between 2006 and 2010.
|But most of that increase was actually due to the rebound inpremium audit impacts that so depressed 2010's premiums: Almostnone of the increase was due to price, either through bureau-filingactivity or changes in carrier discounting.
|ACCIDENT-YEAR RESULTS
|Analyzing experience on an accident-year basis can provideadditional insights into the underlying performance of long-taillines like Workers' Comp, without the distortions of prior-yearreserve adjustments.
|NCCI estimates the combined ratio for private carriers foraccident-year 2011 is 114—down two points from 116 in 2010. Thisimprovement is likely due to understated calendar-year 2010premium.
|On an accident-year basis, the current underwriting cycle turnedin 2006 when the combined ratio was 86. Since then, the combinedratio has increased by almost 30 points.
|
RESERVE POSITION BEGS CLOSER ATTENTION
|The private-carrier reserve position continued its modestdeterioration in 2011 for the fourth consecutive year. Notably,NCCI's estimate of the reserve position for the private carriers asof year-end 2011 shows an $11 billion deficiency.
|After allowing for the permissible discounting of the indemnityreserves for lifetime pension cases, that inadequacy is about $5.9billion, which is about 5 percent of the carried reserves of morethan $113.3 billion. Although most of the deficiency is associatedwith accident years prior to 2002, NCCI's estimate includes somedeficiency in the current accident year.
|The industry needs to keep a close watch on reserve adequacy: Itcan deteriorate very quickly if reserves for the most recentaccident year are initially deficient.
|BUREAU RATE/LOSS-COST CHANGES
|Average bureau-filed rate and loss-cost changes also saw anunfavorable reversal in 2011.
|For most of the previous decade, overall bureau loss costs weredeclining, with ongoing declines in claim frequency offsettingincreases in claim severity. Since 2006, NCCI loss costs generallydeclined, with the declines gradually moderating from -5.3 percentin 2009 to -1.2 percent in 2011.
|In contrast, so far in 2012 loss costs have generally increased,with NCCI loss costs up 2.5 percent on average and countrywidebureau loss costs up 7.8 percent. The countrywide increase in 2012is mostly due to a large increase in bureau loss costs inCalifornia. The increases in NCCI states have been attributable toa number of factors, including longer claim durations.
|CLAIM FREQUENCYDOWN
|Workers' Comp lost-time claim frequency improved in 2011. Afterincreasing 3 percent in 2010, claim frequency in 2011 declined 1percent on average in NCCI states.
|As we surmised in 2011, many of the new claims coming into thesystem—and causing the somewhat higher levels of frequency in thelast couple of years—appear to be small lost-time claims.
|
|
INDEMNITY, MEDICAL AVERAGE CLAIM COSTS SEE MODESTINCREASE
|NCCI research last year suggested that some of the increase inaverage medical claim costs may have been driven by aninflux of small claims, both small lost-time and medical-onlyclaims.
|This supposition was verified by additional NCCI researchshowing that from 2009 to 2010, medical-only claim frequencyincreased 3 percent, while all lost-time claim frequency increased4 percent and small lost-time claim frequency (that is, claims lessthan $2,000) increased by 6 percent.
|This increased frequency of small claims is a reversal of thesignificant drop in the frequency of small claims from 2007 to2009. Over that two-year period, lost-time claim frequency dropped8 percent, while small lost-time and medical-only claim frequenciesdropped 11 percent and 12 percent, respectively.
|We believe that these frequency changes by size of claim weredriven by the depth of the last recession, which producedsignificant changes in claim behavior. As the recession deepened in2008 and 2009, small-claim frequency dropped more rapidly thanlarger-claim frequency. As the modest recovery started, thefrequency of smaller claims increased as the workforce stabilizedand grew a bit in 2010 and 2011.
|This shift in the mix of claims also affected claim severity: In2010, the average indemnity cost per lost-time claim decreased by2.8 percent. In 2011, the average change was a very modest increaseof 2 percent. The average change in medical cost per lost-timeclaim showed similarly favorable results. In 2010, the average costper claim was up just 1.3 percent, while in 2011, the increase was4 percent. These are the lowest increases in average claim costssince the early 1990s.
|In spite of this shift, the underlying cost-drivers for bothindemnity and particularly medical are still present. This meansthat medical costs, absent the claim shifts, are still likely to beincreasing in excess of medical CPI—as they have done for manyyears.
|RESIDUAL MARKET GROWING
|Depopulation of the residual market ceased in 2011, reversingthe trend of declining residual-market premiums that began in 2005.Premiums grew by 7 percent in 2011 to approximately $500 million.Overall, the market share of the residual-market pools serviced byNCCI for 2011 increased from 4.6 percent to 5 percent.
|The combined ratio of the residual-market pools also increasedslightly, from 120 in 2010 to 121 in 2011. At this time, the poolsare quite small, so individual losses and states can have adisproportionate impact on the combined ratio. In 1998–2000, whenthe pools were of similar size in the last cycle, the combinedratio also climbed to nearly 120.
|Residual-market growth in 2011 was fueled by large policiesentering the market. Premium for policies greater than $100,000increased by nearly 50 percent from 2010 to 2011; premium forpolicies between $10,000 and $100,000 grew by more than 15 percentduring the same period. That rapid growth continued in the firstquarter of 2012, with premiums increasing for all policy sizes overthe first quarter of 2011 (with the largest increases occurring inthe largest policy sizes).
|LOOKING FORWARD
|The total P&C insurance industry had its challenges in 2011,and Workers' Comp was no different. Combined ratios remain atunsustainably high levels, and investment returns are notsufficiently high to generate operating returns near the cost ofcapital.
|Although claims frequency declined in the latest year, it isunclear whether it is yet returning to its long-term downwardtrend. The small change in average severity of lost-time claims isat least partly attributable to an increase in the number ofsmaller lost-time claims reported in the last couple of years, andit does not necessarily reflect an underlying reduction in medicaland indemnity cost drivers. In addition, reserve adequacy continuesto slip.
|On the more positive side, the growth in written premiumprovides support that the worst of the recession has passed.Additionally, the industry is well capitalized for the future.
|Overall, NCCI continues to monitor the following areas ofconcern:
- Claim frequency
- The underwriting cycle
- Uncertain impacts from health-care and financial-servicesreforms, including the Federal Insurance Office
- Efforts to expand alternatives to Workers' Comp
Like every other American business, we continue to await a realand sustained economic recovery that will put people back to workand help revive the Workers' Comp industry. Until that happens, wesee continued slow growth and a market whose future remainsuncertain.
|Want to continue reading?
Become a Free PropertyCasualty360 Digital Reader
Your access to unlimited PropertyCasualty360 content isn’t changing.
Once you are an ALM digital member, you’ll receive:
- All PropertyCasualty360.com news coverage, best practices, and in-depth analysis.
- Educational webcasts, resources from industry leaders, and informative newsletters.
- Other award-winning websites including BenefitsPRO.com and ThinkAdvisor.com.
Already have an account? Sign In
© 2024 ALM Global, LLC, All Rights Reserved. Request academic re-use from www.copyright.com. All other uses, submit a request to [email protected]. For more information visit Asset & Logo Licensing.


