

On the official start of the 2012 Atlantic HurricaneSeason, which runs from June 1 until November 30, we spoke withKaren Clark, president and CEO of Karen Clark & Company,about new approaches to catastrophe-loss estimation andpreparation. Clark explains that while catastrophe models andsoftware applications continue to evolve over time, the biggerchallenge for insurers is realizing the full value of suchtools.
|The consensus among forecasters is that the 2012 season should be relatively “normal,” with current projections remaining unfazed by the pre-season storms.The 2011 Atlantic hurricane season produced 20 tropical cyclones,19 tropical storms, seven hurricanes, and four major hurricanes. Itfeatured a record sequence of weak tropical storms, and HurricaneIrene, a powerful Category 3 storm, was the first hurricane of theseason. The season tied 2010, 1995, and 1887 for the third highestnumber of tropical storms.
|We do know, however, that hurricane disasters can occur whetherthe season is active or relatively quiet. It only takes onehurricane (or tropical storm) to cause a disaster and virtuallyunimaginable destruction. Therefore, it is imperative for insurersand risk managers to adequately prepare for every hurricane seasonregardless of seasonal outlook.
|Clark's discussion of risk-assessment and managementprocesses for this season and beyond begins on the next page.Please note that for the purposes of this article, CE denotes a“characteristic event.”
|Q. In terms of what insurers need to be doing, whatare the fundamental requirements for effective catastrophe riskmanagement?
|A. After consulting with dozens of insuranceand reinsurance companies over the past few years, we've found thatinsurers would very much like to have risk-management metrics withthree fundamental qualities: consistency, transparency, andoperational ability. In order to effectively manage catastropherisk, insurers need to fully understand the risk and how it's beingmeasured for their specific books of business. Insurers would alsolike a tool that enables them to monitor the effectiveness of theirrisk-management strategies over time.
|Q. What is/has been the alternative to the CEmethodology?
|A. Catastrophe modeling has been the standardapproach for measuring and monitoring catastrophe-loss potential.While the catastrophe models provide valuable information, they arenot highly effective risk-management tools. The numbers generatedby the models tend to swing widely from model to model and updateto update, and the opaqueness of the models makes it very difficultfor the modelers and the model users to decipher the true driversof changes in the modeled loss estimates, particularly forcompany-specific books of business.
|Q. What differentiates the CE approach from othermethods?
|A. The CE approach is transparent and is theright balance between fully probabilistic and deterministicapproaches to catastrophe-loss estimation. Many companies,realizing the shortcomings in the probabilistic models, have turnedback to scenario-based deterministic approaches that are moreconcrete but don't give a complete picture of catastrophe-losspotential. CEs are defined-probability events created for thereturn periods of most interest to insurers—such as one-in-100 andone-in-250 years—and are floated across a book of propertyexposures to provide a complete analysis of the loss potential fromrepresentative return-period events.
|Q. How does this complement the catastrophe modelsand/or address the limitations of the models?
|A. CEs are based on the same scientific dataunderlying the catastrophe models, but instead of generating a lotof random events, the science is used to develop return-periodevents representative of specific regions and perils. The modelsgenerate a large catalog of random events, calculate the lossesfrom each event, and then sort the losses from most to least severeto estimate the 100- and 250-year probable maximum losses(PMLs).
|Because of the modeling process, PMLs are not operational andare highly volatile numbers. Instead of one number, CEs provide arange of loss estimates for the 100- and 250-year events that arestable, operational-risk metrics that can be drilled down tocounties, ZIP codes, and even individual policies forrisk-management purposes. In this way, CEs provide valuableinformation that addresses the model limitations and complementsthe model-generated information. 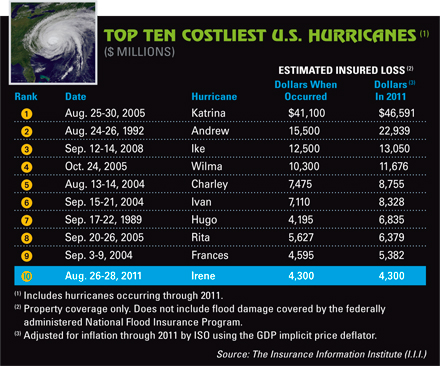
Q. How does it foster a more consistent andtransparent view of hurricane risk specifically?
|A. The CE footprints are completely transparentto the user so they can be easily peer-reviewed by internal andexternal experts. The damage functions that are used to calculatethe losses are also visible to the user. Because they are based onthe most credible and reliable scientific data, the CEs remainconstant from year to year, thereby providing a consistentyardstick for measuring and monitoring risk over time.
|Q. What in your opinion is thegreatest challenge P&C insurers face in predicting andpreparing for hurricanes?
|A. By focusing on PMLs to manage risk, insurersfrequently are surprised by actual events that cause losses overtheir PML estimates. While this may be because of “model miss,” themore significant problem is that model-generated PMLs mask thelarge loss potential from 100-year events making landfall inspecific locations. PMLs give a false sense of security, while theCE analysis clearly shows where companies have exposureconcentrations that will result in losses well above their 100-yearPML loss estimates even from 100-year events.
|Q. Would you elaborate on how insurers are using theCE methodology to:
|1. Better understand cat risk and exposureconcentrations.
|Because the CEs are fully transparent to the user, insurers knowexactly the types of events to which they are managing theirbusiness. CEs make the events and loss potential more vivid andreal to senior executives and boards of directors. Byfloating 100-year CEs across a company's exposures, exposureconcentrations that may be missed by a model are clearly identifiedand spikes in large loss potential are highlighted.
|2. Manage and monitor cat risk over time. Couldthis potentially diminish claims volume/costs in the longrun?
|Because the CEs are constant from year to year, risk-managementstrategies designed to reduce the peak exposure concentrations canbe monitored over time. This will certainly diminish the claimsvolume for individual companies when major hurricanes occur. Byfocusing on where major hurricanes are likely to cause very largelosses, a company can make sure they are not overexposed to eventsthat will tax their claims-handling ability and potentially impairtheir solvency.
|3. Establish a scientific benchmark to test the catmodels.
|The CEs are based on the same science underlying the cat models.Because the loss estimates generated by the different cat modelsand model updates can diverge significantly, the CE loss estimateshelp a company determine which model is more credible for theirspecific books of business. For companies that blend multiplemodels, the CE analysis can support selection of appropriatemodel-blending weights.
|
Q. Some media reports speculate that climate changeis causing an increase in the severity and frequency of hurricanes.Are insurers lending credence to this? How does this theory alignwith proven science?
|A. There is no proven science with respect toclimate change and hurricane frequency or severity. According tothe expert opinion of the Intergovernmental Panel on Climate Change(IPCC), climate change is likely to decrease hurricane frequencyand increase hurricane intensity over the next 20 years. Neither ofthese impacts is evident in the data so far, particularly withrespect to land-falling hurricanes. For insurers and claimsprofessionals it just takes one major hurricane striking apopulated area to create a very large industry loss—and companiesshould be prepared for this at all times. Historically, the worstloss given today's property values would be a repeat of the 1926Miami hurricane, which is projected to cause nearly $100 billion ofinsured loss if it occurs again.
|Q. Any surprises during the 2011 season? Whatabout Irene?
|A. Hurricane Irene is a perfect example of thebenefit of the CE approach. If Irene had maintained Category 3intensity and taken the same path—hugging the New Jersey coast andmaking landfall across western Long Island—the industry losseswould have been over $100 billion. Individual company losses wouldhave been higher than the model-generated PMLs and would have goneover the top of many reinsurance programs. The Northeast hurricaneCE is a Category 3 storm with landfall points at 10-mile incrementsstarting near Long Beach, N.Y. The CE analysis prepares companiesfor realistic events that take typical tracks for each region.
|Want to continue reading?
Become a Free PropertyCasualty360 Digital Reader
Your access to unlimited PropertyCasualty360 content isn’t changing.
Once you are an ALM digital member, you’ll receive:
- All PropertyCasualty360.com news coverage, best practices, and in-depth analysis.
- Educational webcasts, resources from industry leaders, and informative newsletters.
- Other award-winning websites including BenefitsPRO.com and ThinkAdvisor.com.
Already have an account? Sign In
© 2024 ALM Global, LLC, All Rights Reserved. Request academic re-use from www.copyright.com. All other uses, submit a request to [email protected]. For more information visit Asset & Logo Licensing.


