

How Active Was2011?
November 30 was the official last day of the 2011 Atlantichurricane season—an exceptionally active one from the perspectiveof basinwide activity, but another below-average season in terms ofU.S. hurricane losses. Persistently high sea-surface temperaturesand lower-than-average levels of wind shear contributed to theformation of 19 tropical storms (one unnamed)—the third-highestcount on record. Hurricane and major hurricane formation, at sevenand three, respectively, were slightly above average.
|Interestingly, only 37 percent of tropical storms achievedhurricane status in 2011, compared to the long-term average of 55percent. This hurricane-intensification metric, however, is highlyvariable from year to year, and many past years have had similarlylow proportions. What was unusual about 2011 compared to pastseasons with a low rate was the anomalously high count of tropicalstorms. Because conditions that favor tropical-storm developmentare typically the same ones that help them intensify to hurricaneor even major hurricane status, past years with proportions of lessthan 40 percent also had average or below average counts oftropical storms.
|Part of this apparent anomaly can be attributed to the presenceof dry air and limited tropical moisture in the main developmentregion for Atlantic hurricanes during periods of tropical-stormdevelopment. Thus, while many past years have demonstrated that ahigh count of tropical storms does not necessarily mean a highnumber of landfalls, 2011 has shown that more tropical storms doesnot even necessarily mean more hurricanes.
|Translating Basinwide Activity to Landfalls and Loss
Let's now look at how the season measured up to pre- andmidseason forecasts. Figure 1 shows that many forecastingorganizations, even later in the year, underestimated the number oftropical storms and overestimated the number of hurricanes. This ispartly because most predictions of hurricane counts apply thelong-term hurricane intensification rate (55 percent) to thepredicted count of tropical storms. So, in a year like 2011 with anintensification rate that differs significantly from the long-termaverage, the predictions are not likely to verify well compared toobservation.
|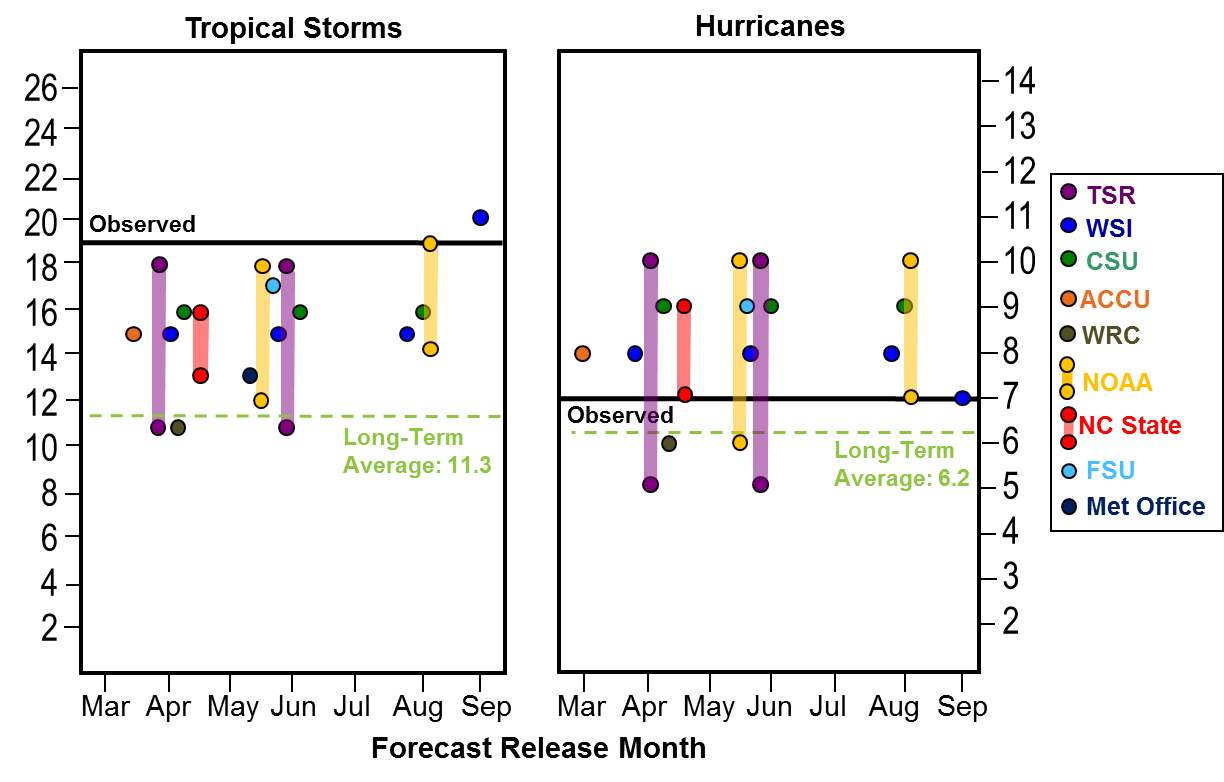
Figure 1. Seasonal predictionsissued by various forecast organizations.
|Furthermore, even the most precise predictionsof basinwide activity (and they are far from precise) do notnecessarily translate into similar expectations regarding potentialdamage-causing storms. What is most important to those concernedabout insured hurricane losses—and markedly absent from mostseasonal forecasts—is a projection of how many storms will impactland and property. This brings up another notable feature of the2011 season. Of the seven storms that achieved hurricane strengththis year, only one—Hurricane Irene—made landfall in theUnitedStatesas a hurricane.
|AIR's published research has shown that during years with warmsea-surface temperatures (which has been the case every Atlantichurricane season since 1995), the storm-development pattern shiftsto the east and north, closer to the coast ofAfrica. Storms thatform in this region are more likely to curve north before reachingthe U.S., thereby decreasing the probability of landfall. Thus, foran individual season, basinwide activity is not always a reliableindicator of potential high losses; six seasons since 1995 haveexperienced above-average tropical-storm activity with zero or justone U.S. landfall. In fact, with a long-term average of about twoU.S. landfalls per year, only five seasons since 1995 have hadabove-average landfall activity.
|Hurricane Irene
Caribbean
|In late August, Hurricane Irene, the first hurricane of theseason, wove through the Caribbean islands with maximum wind speedsof over 110 mph. Irene battered several islands, causingsignificant losses to the Bahamas, Puerto Rico and the DominicanRepublic. AIR issued a final insured loss estimate of $400–800million (U.S.) in the Caribbean territories.
|As with all major events, AIR deployed an engineering team toconduct a post-disaster field survey of the worst-affected regions.The team found that building codes were stringent and wellenforced, and the levels of observed damage from both wind andflood were consistent with AIR's expectations. Wind damage towell-built concrete structures was generally limited to the roof,while the less prevalent wooden structures suffered moresubstantial damage. Commercial properties suffered significantdamage to signage.
|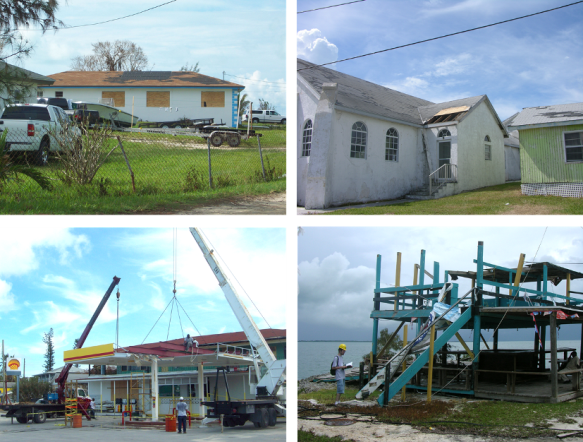
Figure 2. As expected, winddamage to well-built concrete structures was limited to the roof(top) and, on commercial buildings, to signage (bottom left).Wood-frame structures, which are much less prevalent in theBahamas, were more severely affected. The structure in the bottomright panel was virtually demolished by Irene's eye wall as ittraversed Abaco. (Source: AIR)
|AIR researchers also met with local insuranceagents and building contractors and learned that, contrary to thedefault assumption of uniform take-up rates (insurance penetration)across the islands, there are significant differences among islandsin the Bahamas. As with other findings from the field, thisimproved understanding of take-up rates gained from the survey willbe incorporated into the model and will allow more accurateinsured-loss estimates for future real-time events.
|United States
|After exiting the Bahamas, there was significant uncertaintyregarding Irene's future track and intensity. Figure 3 shows theevolution of the risk to the U.S. insurance industry as Ireneapproached the U.S. coastline. As the scenarios show, most modelsearly on expected Irene to make landfall at Category 2 or evenCategory 3 strength, with the potential for insured losses inexcess of $10 billion (U.S.). While these more damaging scenarioswere not realized, it reinforces the high sensitivity of loss toeven slight changes in storm track and landfall intensity.
|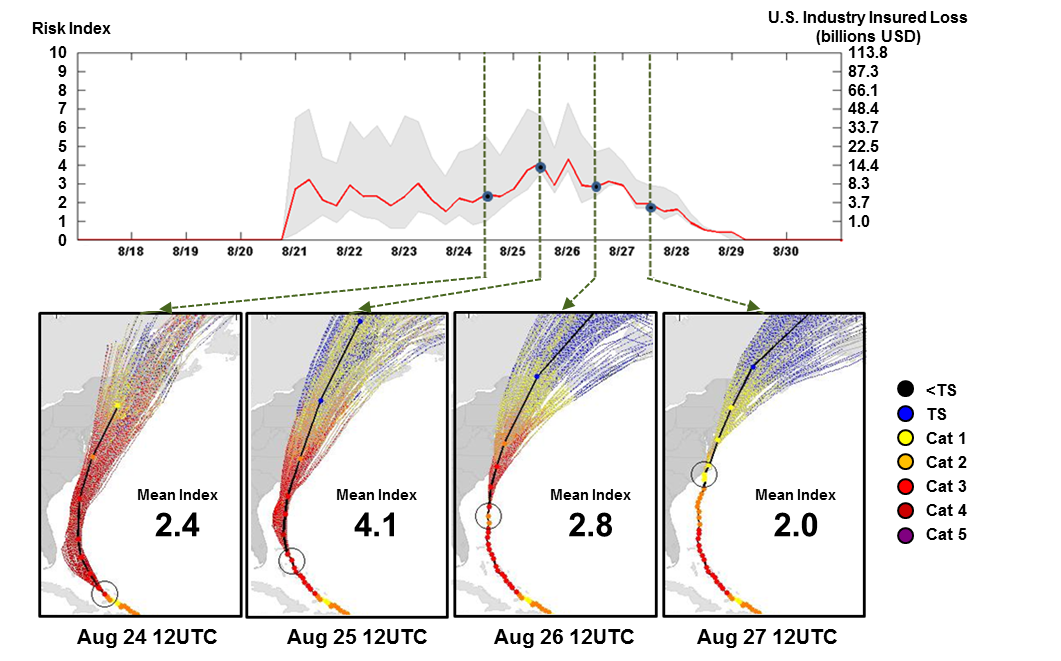
Figure 3. AIRClimateCast® Risk Index for HurricaneIrene (top) provides a real-time assessment of insured risk usingoperational model forecasts of storm track and intensity combinedwith AIR's sophisticated stochastic simulation techniques; selectedtrack and intensity scenarios (bottom).
|As Hurricane Irene came closer to the North Carolina coastline,the models reached some consensus that Irene would strike atCategory 1 strength and then move into the Northeast. The HurricaneRisk Index value estimated just prior to landfall was about 2.0,corresponding to an industry loss of about $3.8 billion (U.S.). Thelatest industry loss estimate from Property Claim Services (PCS) is$4.1 billion.
||
Closing Thoughts
While elevated sea-surface temperatures tend to increasebaseline storm formation, there are a variety of complex factorsthat dictate whether storms will intensify to hurricane strengthand ultimately whether they will be directed toward land at thatstrength. The 2011 hurricane season has demonstrated once againthat a high level of basinwide activity does not necessarilytranslate into high insured losses. In line with AIR's perspectiveon U.S. loss potential during warm sea-surface temperature regimes,historical experience since 1995 has not justified dramaticadjustments to the modeled frequency of damaging storms.
|The high variability in year-to-year activity means that thebest approach to managing the risk from hurricanes is to preparefor events before they occur using a stable and robusthurricane model whose underlying assumptions reflect the reality ofthe physical phenomenon. This can be supplemented by a number ofvaluable tools to manage real-time risk as a storm is approachingthe U.S. coastline.
Want to continue reading?
Become a Free PropertyCasualty360 Digital Reader
Your access to unlimited PropertyCasualty360 content isn’t changing.
Once you are an ALM digital member, you’ll receive:
- All PropertyCasualty360.com news coverage, best practices, and in-depth analysis.
- Educational webcasts, resources from industry leaders, and informative newsletters.
- Other award-winning websites including BenefitsPRO.com and ThinkAdvisor.com.
Already have an account? Sign In
© 2024 ALM Global, LLC, All Rights Reserved. Request academic re-use from www.copyright.com. All other uses, submit a request to [email protected]. For more information visit Asset & Logo Licensing.


