

Food Services Sector Offers Tasty RisksSound underwriting appetite keeps insurers from relying onpot luck
|The nations eating and drinking establishments represent one ofthe most vibrant and fast-growing segments of the U.S. economy. By2004, the total number of accounts in this sector had pushedappreciably beyond the half-million mark and were generating astaggering $350 billion in annual revenues.
|The very size of the food services sectorwith estimated standardlines premium potential of about $6.5 billionhistorically has madeit an attractive target for commercial lines agents andinsurers.
|
Of late, this sectors creation of roughly 4,000 new accountseach year has further bolstered its attractiveness as carriersstruggle to expand premium writings despite softening marketconditions.
|With about 200,000 accounts each, the full-service restaurantand limited-service restaurant segments account for 75 percent ofoverall sector establishments and generate 80 percent of itsrevenues. Other limited service eating placesincluding coffee,doughnut and bagel shops; cafeterias; and ice cream shopsaccountfor another 8 percent of establishments.
|Alcoholic drinking places comprise a bit less than 10 percent ofthe total sector. Special food services, the final segment,comprises food service contractors, caterers and mobile foodservices.
|As numerous carriers have demonstrated, size and growth alone donot necessarily guarantee profitable underwriting results in thisimportant market segment. Indeed, the eating and drinking industryscomplex makeup, its regional nuances and changing dynamics all butdemand that carriers carefully evaluate each distinct sub-segment,develop a detailed underwriting appetite, and then target onlythose risks for which they have adequate underwriting expertise andan appropriate rating structure.
|While recent growth for the entire food services sector has beenstrong, its various sub-sectors have demonstrated very disparategrowth patterns. This is a key indicator of special issues inunderwriting (such as changes in loss frequency distribution) aswell as in loss control and even premium audits.
|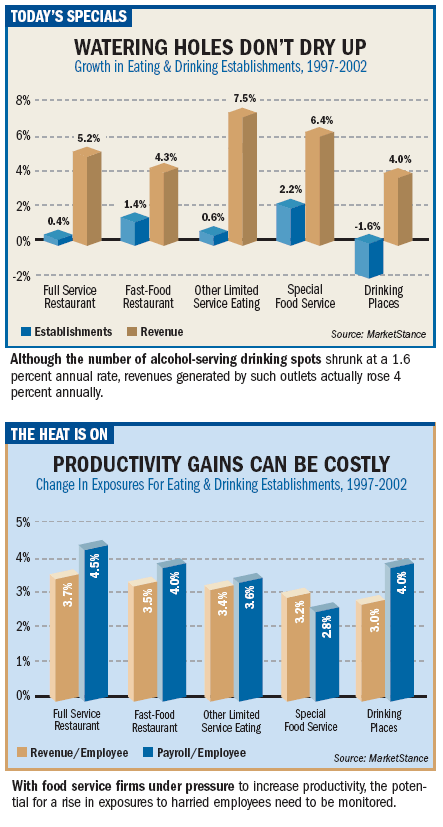
For example, the special food services sub-sector has recordedthe strongest of the overall sectors growth, at least in terms ofthe number of accounts. This groups 31,000 accounts grew at a 2.2percent annual pace over the 1997-2002 periodalmost double the paceat which the economy as a whole added new accounts.
|In contrast, the number of alcoholic beverage drinking placesdeclined at a 1.6 percent annual rate from 1997-to-2002.
|However, while drinking places were one of the few businessclasses to experience appreciable, sustained decline in the numberof accounts, the revenues generated by these establishmentsactually rose at a brisk 4 percent annual rate. (This is only a bitslower than revenue growth in the seemingly booming fast foodsegment.)
|In fact, growth of revenue generated per drinking place wasespecially high at 5.6 percent per year, indicating the importanceof both effective account retention and premium audit practices tothe successful writing of these alcohol-related risks.
|Within the food services industry, the sources of an individualestablishments revenues are an important factor in its lossexposures and insurance coverage needs. Among full-servicerestaurants, for example, alcoholic beverages account for 17percent of revenue on average and are served by fully 66 percent ofthese establishments.
|In contrast, alcohol is a minimal component of total revenueamong limited-service restaurants and other limited service eatingplaces (snack shops, etc.). That being said, however, among the 9.5percent of limited-service restaurants that report servingalcoholic beverages, about 8 percent of revenues came from thissource.
|With respect to alcohol-related exposures, caution is called forin two segments. The first is special food services. Here almost10.5 percent of establishments report serving alcohol. While thisis a relatively limited share of accounts, their exposure isroughly as sizable as that in full-service restaurants, with about15.4 percent of their revenues derived from alcoholic beveragesales.
|Smaller still in number is alcohol-serving food servicecontractors, yet these firms reported generating almost 25 percentof their revenues from alcoholic beverages.
|What is the other segment with an unexpected alcohol-relatedexposure? Well, its full-service restaurants again. This time,however, its the firms selling packaged alcoholic beverages foroff-premises consumption. Nationally, only 2.6 percent ofrestaurants reported selling packaged alcoholic beverages, butthose that did realized almost 10 percent of their revenues fromthis source.
|However, there are other issues besides alcohol exposure toconsider if you wish to successfully underwrite the rapidlychanging food services industry.
|As in so many sectors of the U.S. economy, food service firmshave been under enormous pressure to increase productivity. Indeed,almost anyone whos had the opportunity to watch a burger assemblyline in operation for a few minutes can appreciate the potentialimpact on loss frequency each time productivity increases anothernotch.
|A workers compensation claim arising from deep-fat frying goneamok, or a slip-and-fall claim caused by a stray French fry arejust two of the readily apparent elements of loss potential thatcan be exacerbated by an accelerating pace of food service.
|Surprisingly, revenue growth per employee has been fairlyuniform across the various food services segments. Such growth wasa bit stronger in the full-service segment (rising at a 3.7 percentaverage pace). Nevertheless, revenue-per-employee in both fast-foodrestaurants and other limited service eating places (snack foodshops) were not far behind, with each recording 3 percent-plusgains in this measure of productivity.
|In contrast, payroll-per-employeea measure of growth in therating basis for workers comprose significantly faster in thefull-service segment than it did in special food services. As aresult of the sizable rise in premiums that resulted, its quitelikely that workers comp loss experience improved significantlyamong full-service restaurant workers.
|In the special food services segment, however, the more sluggishpace of payroll growth means that rising loss costs will likelyoutpace the premiums collected.
|Nationally, full-service restaurants account for a sizable 45percent of all eating places. However, the composition of thesector varies appreciably state-by-state. Full-service restaurantscomprise the largest share of all eating places in the Northwest,and in many of the Mountain and Northern Plains states.
|Many Central Atlantic and Midwest states, in comparison, tend tohave fairly low percentages of full-service restaurantsand, byimplication, larger proportions of fast-food and snack foodshops.
|Indeed, the highest share of fast-food and snack-food shopsrelative to total eating establishments exists in Maryland, whichat a full 51 percent narrowly edged out New Jersey and the Districtof Columbia for this distinction. Other states with especially highconcentrations of fast-food risks include the quick-growth marketsof Nevada and Utah.
|In contrast, Floridaanother rapid-growth statehas a relativelylow concentration of fast-food establishments in its quite largefood services sector.
|Frederick “Fritz” Yohn is the developer of “MarketStance,” amarket analysis tool for U.S. commercial property-casualty insurersand a registered trademark of IntelliStance, LLC, in Middletown,Conn.
|Flag: Recipe For Success
|Stick To The Basics
|By Fritz Yohn
|Fast-food vs. sit-down restaurants, alcoholic beverages vs. dryestablishments, fast growth vs. modest growth localesthe number ofpotential combinations of characteristics within the food servicessector might seem as overwhelming as the ingredients typical ofpot-luck concoctions.
|However, the recipe for success in this sector relies simply onsticking to the basics. Following such time-tested techniques andingredients will assure that your offering will produce acrowd-pleasing performance.
|Identify a segment, or set of segments, with homogeneous risksthat match your underwriting expertise.
|Make sure that an adequate number of prospective accounts existfor those segments.
|Be certain those prospective accounts have positive growthprospects.
|Finally, select the target group of states in which thiscombination of characteristics is most consistent.
Reproduced from National Underwriter Edition, April 15, 2005.Copyright 2005 by The National Underwriter Company in the serialpublication. All rights reserved.Copyright in this article as anindependent work may be held by the author.
Want to continue reading?
Become a Free PropertyCasualty360 Digital Reader
Your access to unlimited PropertyCasualty360 content isn’t changing.
Once you are an ALM digital member, you’ll receive:
- All PropertyCasualty360.com news coverage, best practices, and in-depth analysis.
- Educational webcasts, resources from industry leaders, and informative newsletters.
- Other award-winning websites including BenefitsPRO.com and ThinkAdvisor.com.
Already have an account? Sign In
© 2024 ALM Global, LLC, All Rights Reserved. Request academic re-use from www.copyright.com. All other uses, submit a request to [email protected]. For more information visit Asset & Logo Licensing.


