Risk professionals for large commercial businesses are “significantly more satisfied” when 11 key performance indicators (KPIs) are met by brokers and insurers. That’s the main finding in the inaugural 2014 Large Commercial Insurers Report from J.D. Power and RIMS, released Dec. 10.
The 11 KPIs—best practices that have the most influence on customer satisfaction—focus on three core areas: limiting customer-reported billing errors and renewal issues, understanding the customer’s business, and communicating effectively.
The survey came about because property and casualty insurers who work with large businesses wanted a better understanding of what their clients meant by “customer service,” explains Timothy Bebout, commercial insurance practice leader at J.D. Power, in an interview. He sees this survey as a first step toward figuring out what kind of relationship risk managers want to have with their brokers and insurers and how to improve that relationship.
If there isn’t a plan for this interaction, “there’s a deficit in how risk managers perceive the experience.” Bebout says. “This is not a group that’s interested in self-service,” he adds.

Interaction drives customer satisfaction
According to the report, enterprise risk management (ERM) is becoming a more prevalent risk management function at many organizations, with nearly 40% of risk professionals indicating that ERM falls within their area of responsibility.
ERMs have a broader, more strategic role than just risk management, Bebout says. With increased responsibility across their organizations, the ERMs may be responsible for areas beyond their realm of expertise; for example, a finance officer may be responsible for safety as well as minimizing financial risk. ERMs want brokers and insurance companies to understand their company’s business issues fully and to propose solutions for managing risk.
The report found that interaction is the second-most impactful factor driving overall customer satisfaction with insurers across product lines, accounting for nearly one-fourth of the overall model used in each of the product line indices. If the broker doesn’t meet expectations for regular, meaningful interaction, satisfaction levels drop, and there’s a significant impact on retention, renewals and new business. Risk managers are dynamic in assessing risk, and brokers who want their business also have to be more dynamic.
Developing the best solution for the client’s business is key, Bebout says. Brokers should have good relationships with several carriers because one insurance company may not have all the coverage that a business needs. But brokers shouldn’t talk about coverage in a vacuum; they must anticipate the client’s needs so coverage isn’t overlooked, and new coverage for new risks is provided as it becomes available, increasing client satisfaction.

Using technology to manage risk
One way brokers can differentiate themselves—and provide better customer service—is to help their clients use technology effectively to manage premiums and allow underwriters to better evaluate risk.
For example, commercial auto is the most competitive market, according to the report. The risk manager for a company with a fleet of vehicles may be considering investing in telematics, equipping company vehicles with devices that measure hours, miles, location and fuel consumption. Bebout says the broker and carrier should be able to advise the risk manager about the effect the investment could have on premiums and risk underwriting.
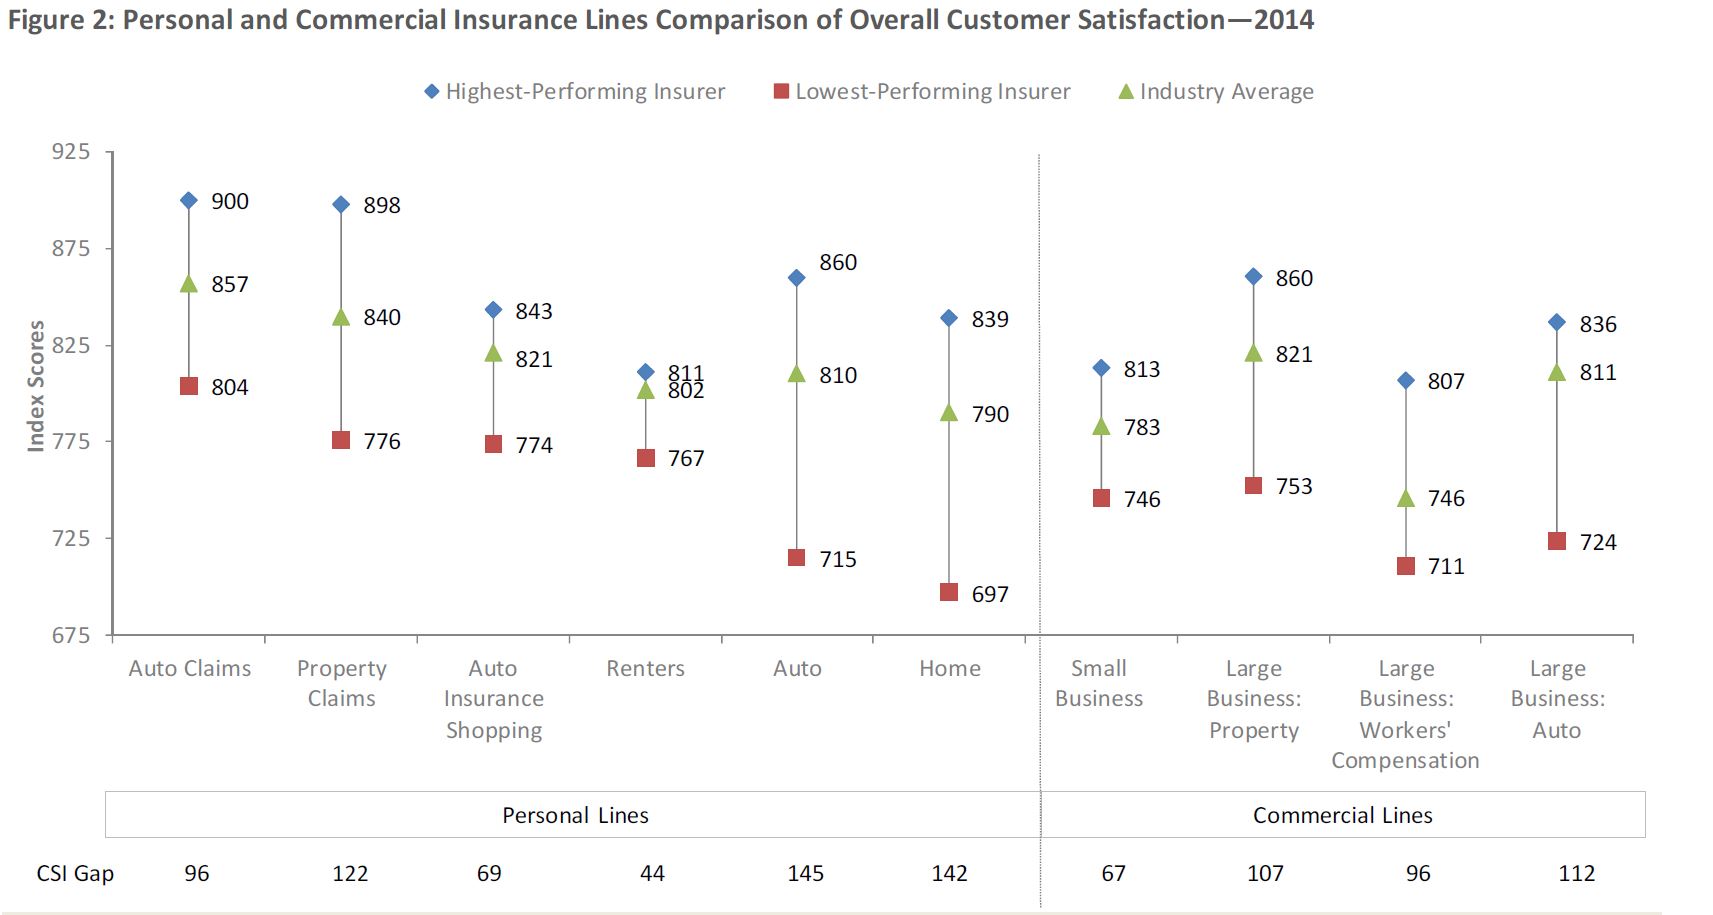
Click chart to enlarge. Source: J.D. Power
Price still matters
“I was pleasantly surprised that risk managers were so candid about what’s important to them,” Bebout said. He believes this type of effort needs to continue. Are readers—brokers, carriers and businesses—paying enough attention to how important good customer service is to their overall success?
The report’s billing results, which have an effect on the future relationship, also caught Bebout’s attention. He was surprised that price was second or third on the list, but all things being equal, price is still the determining factor. Billing and payment is the lowest-scoring factor in the auto and workers’ compensation indices, and is among the lowest-scoring in the property index. However, billing and payment satisfaction is significantly lower among workers’ compensation customers (725 respondents) than among property (808 respondents) and auto (793 respondents) customers.

Key findings
- Price is the leading factor driving satisfaction among auto customers.
- Interaction is the second-most impactful factor driving overall customer satisfaction with insurers across product lines, accounting for nearly one-fourth of the overall model used in each of the product line indices.
- Claims frequency influences overall customer satisfaction levels. As the frequency of claims increases, customer satisfaction decreases. Claims satisfaction is lowest among workers’ compensation customers, among whom 94% have filed at least one claim with their current primary commercial insurer in the past 12 months.
- Flexibility in designing and implementing insurance programs is a KPI for which there is relatively low compliance at 56% for property and 50% for workers’ compensation. Overall satisfaction erodes by 138 points and 316 points respectively when this KPI is not met.
- Ensuring that an insurance representative, such as an engineer or underwriter, is involved during both the service interaction and claims processes are two KPIs that drive satisfaction among property customers. Overall satisfaction erodes by 100 points when an insurer is not involved during a service interaction.
- Providing at least two in-person interactions is another critical performance metric for brokers. Eighty-one percent of customers indicate they have had at least two in-person interactions with their broker. Overall satisfaction declines by 73 points among customers who didn’t have at least two in-person interactions.
Nearly 1,000 risk professionals or employees of an organization that provide oversight or are members of their organization’s risk management team responded to the survey. Organizations included in the report have at least $100 million in annual revenue or operating budget, and have purchased a commercial property, workers’ compensation or auto policy with a profiled insurer or broker.
The report provides an independent and objective measure of overall satisfaction levels among large business insurance risk professionals in the United States and Canada. The full report examines industry-level performance metrics among large business commercial insurers and brokers, and highlights best practices that are critical to satisfying large business insurance risk professionals.
To read the full report visit J.D. Power’s web site.
© Arc, All Rights Reserved. Request academic re-use from www.copyright.com. All other uses, submit a request to TMSalesOperations@arc-network.com. For more information visit Asset & Logo Licensing.